
Mobile UA Game KPIs: How to Define, Measure, and Optimize
Get a practical framework for tracking mobile UA KPIs like CPI, LTV, D7 retention, and ROAS so you can scale your game profitably.
Mobile UA Game KPIs: How to Define, Measure, and Optimize
Key mobile game KPIs for developers who want to scale profitably, not just grow fast
Most mobile studios track user acquisition the wrong way. They watch CPI go down, installs go up, and call it a win. Then they wonder why revenue doesn't follow.
The studios scaling profitably operate differently. They treat UA as a closed loop where every dollar is tracked from ad impression through install and retention, to lifetime value. They define clear mobile UA KPIs before spending. They make scaling decisions based on early cohort signals, not top-of-funnel volume. And they kill campaigns before the damage is done — not after.
Here's what that actually looks like in practice.
The UA Closed Loop: A KPI Hierarchy
Before diving into individual mobile game KPIs, the framework matters. The UA Closed Loop works like this:
CPI is your cost input → D7 retention is your early quality signal → LTV is the truth → ROAS tells you whether the system is profitable over time.

Define thresholds for each before you start or increase spend. Evaluate by cohort, not campaign average, and start optimizing when signals move — not weeks later.
Each metric only has meaning in relation to the others. A studio managing all four as a connected system is going to have a clearer path for mobile UA optimization than a studio watching each metric in isolation.
What Are the Key Mobile Game KPIs?
A metric is a number. A KPI is a target tied to your game's genre, stage, and business model — one that tells you whether to pause, fix, or scale. Without that distinction, you're not optimizing. You're watching dashboards.
The mobile game KPIs that drive profitable UA:
KPI | What It Measures | Why It Matters |
CPI (Cost Per Install) | What you paid to acquire a single user | A cost input, not a quality signal — it tells you nothing about whether that user was worth acquiring |
D1 / D7 / D30 Retention Rate | The % of users still active 1, 7, or 30 days after install | Your earliest signal on user quality — predicts mobile game LTV before the budget is spent |
LTV (Lifetime Value) | Total revenue a user generates over their lifetime in your game | Sets the ceiling for every acquisition decision — sustainable growth benchmark is a 3:1 LTV to CAC ratio |
ROAS (Return on Ad Spend) | Revenue generated per dollar of ad spend, tracked as a curve over time | Your profitability KPI — only meaningful when evaluated against a defined payback window |
Now that we have defined the critical mobile game KPIs, let’s explore how you can use each one to optimize and grow your UA performance.
CPI: Your Cost Input
CPI is an input metric — it only makes sense when read against mobile game LTV. A $1.50 CPI sounds efficient, until you're in a genre where average LTV barely clears $2.80. A $6 CPI can make complete sense in a mid-core RPG — think titles in the 4X strategy or card battler space — where strong D90 ROAS justifies the acquisition cost.
The number is context-dependent. What matters is the relationship between what you paid and what you got back.
D1, D7, D30 Retention: Your Early Quality Signal
D7 is where you can still change something. By D30, the budget is already spent.
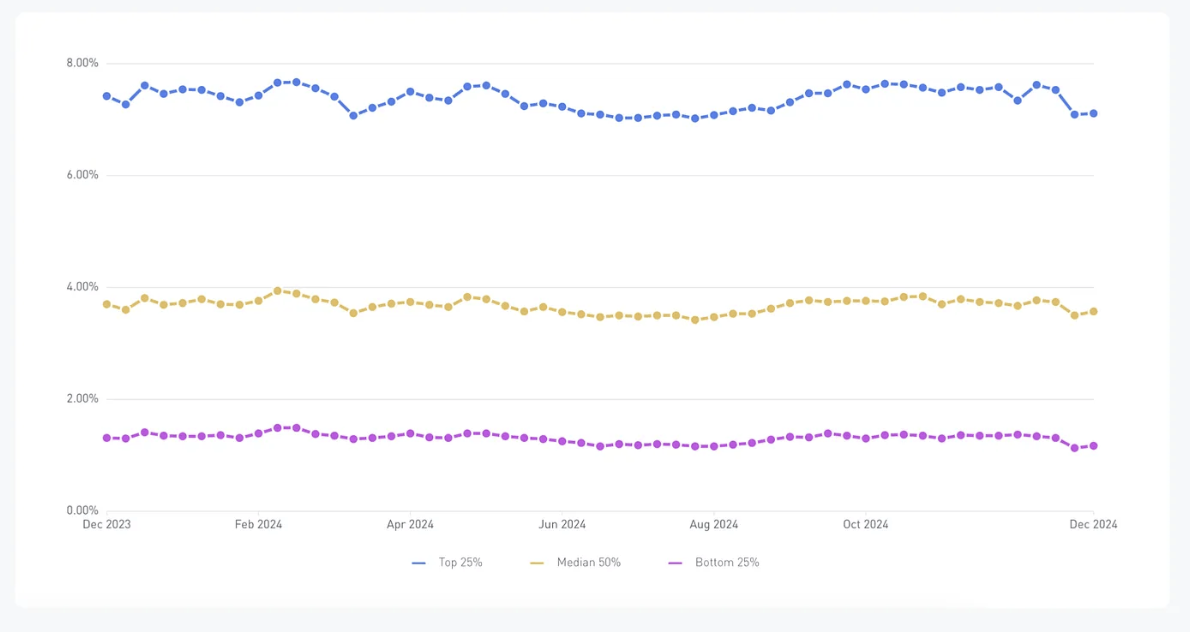
According to GameAnalytics' 2025 mobile gaming benchmarks, the top 25% of mobile games hold D7 retention at 7–8%. The median sits between 3.42% to 3.94%. Those numbers are a useful reference, but your KPI threshold should be calibrated to your genre, not the industry average. A casual puzzle game and a mid-core RPG shouldn't share the same D7 target, for example.
If you can establish the relationship between D7 retention and 30-day revenue per cohort, you've built an early warning system. Then, you can make scaling decisions in week one instead of waiting a month for the revenue signal.
When a cohort tracks below your D7 target, it's telling you something about the creative, the channel, or the product itself. The faster you identify which, the less it costs you.
LTV: The Truth
Your CPI must always sit below LTV. The industry benchmark for sustainable growth is a 3:1 LTV to CAC ratio, and it's one of the most useful diagnostic tools a producer has.
If you're not there, that's a product problem as much as a UA one — which means you have direct influence over it. Start by identifying where the gap lives: is D30 retention underperforming genre benchmarks? Is your monetization model leaving revenue on the table in the first 72 hours? Is the progression economy creating natural IAP moments, or working against them?
Tightening the core loop and restructuring reward cadences can move LTV in ways no UA campaign can replicate. Fix the foundation, and the acquisition math gets easier.
ROAS: Your Profitability Signal
ROAS is only meaningful as a curve you track over time. A strong D7 ROAS can mask a cohort that converts early then churns, inflating short-term numbers before you get the full LTV picture.
Define your payback window before setting the campaign live:
30 days for casual, ad-monetised games
60 days for hybrid-monetisation titles
90–180 days for mid-core IAP games
That payback window is your kill-or-scale gate. If you're not measuring against a pre-defined window, you're just watching revenue and hoping.
Cohort Analysis: Stop Looking at Blended Numbers
Blended CPI across a campaign hides everything useful. A campaign might show a healthy average while one creative variant is consistently attracting users who churn on Day 3 and another is quietly outperforming on LTV by 40%. The blended number doesn't tell you either of those things.
Cohort analysis — tracking users grouped by install date, source, creative, and geo — is how you find those differences. If retention shifts between users acquired January 1st vs January 15th, something changed. Was it the creative? Did onboarding improve? Did a balance patch land? You can only answer that with cohort-level visibility.
Tag every install. Watch every cohort.
Where the Loop Breaks
The mobile game KPI framework makes sense in theory. In practice, it breaks at predictable points.
The most common failure: creative teams and analytics teams don't talk to each other. Creatives get evaluated on CTR and installs. Analytics evaluates cohort LTV and retention. A creative can hit its KPI while systematically attracting users who churn on Day 3. It gets scaled, and the damage is done before anyone notices.
The fix is connecting creative reporting to cohort outcomes. Every creative variant should carry retention and early revenue data.
The second failure: acting too slowly on early signals. A campaign showing low CPI gets scaled aggressively. By the time the LTV data arrives three weeks later, the budget is gone and the cohort underperformed.
The solution? Test faster. Speed of iteration matters as much as accuracy of measurement.
Get in touch with us at Plunge to see how our expert consultants can help you build a UA KPI framework that drives real growth.
FAQs
What is a good D7 retention rate for mobile games?
The top 25% of mobile games hold D7 retention at 7–8%, according to GameAnalytics' 2025 benchmarks. The industry median sits between 3.42% to 3.94%. The right target for your studio depends on genre — a mid-core RPG and a casual puzzle game shouldn't share the same threshold.
What is a healthy LTV to CAC ratio for mobile UA?
The standard benchmark for sustainable growth is 3:1 — for every $1 spent acquiring a user, you should generate $3 in mobile game LTV. Below that ratio, acquisition spend is unlikely to be profitable without a significant product or monetisation change.
What payback window should I use for mobile game ROAS?
It depends on your monetisation model. Casual, ad-monetized games should target a 30-day payback window. Hybrid-monetisation titles typically work on 60 days. Mid-core IAP-heavy games can justify 90–180 days. The key is defining the window before you start spending — not after the campaign is live.
What is cohort analysis in mobile user acquisition?
Cohort analysis means grouping users by a shared characteristic — install date, acquisition source, creative variant, or geography — and tracking their behaviour separately from other groups. It's what lets you see that one creative is attracting high-LTV users while another is bringing in users who churn on Day 3, even when the blended campaign average looks fine.
How do you calculate ROAS for a mobile game?
ROAS = Revenue Generated ÷ Ad Spend, measured over a defined time window (typically D7, D30, or D90 depending on your game type). The number is only meaningful as a curve — ROAS at D7 versus D30 versus D90 tells a very different story about cohort quality.
Why doesn't a low CPI mean successful UA?
CPI measures what you paid per install — not whether that user was worth acquiring. A $1.50 CPI in a genre where average LTV is $2.80 is a bad outcome. A $6 CPI in a mid-core title with strong D30 ROAS can be a great one. CPI only makes sense in relation to LTV.