Breaking Down the Monetization Strategies of Consumer Apps, by Category
An app's category determines its monetization model. Discover seven consumer app categories and their dominant monetization strategies, with iOS vs. Android breakdowns and tips you can use right now.
We often see studios treating monetization problems as tuning problems. Teams spend quarters testing free trial length or annual plan framing, optimizing the mechanics of a paywall rather than questioning whether the paywall is the right mechanism at all.
But the dominant lever isn't the paywall. It's the category. Each category has a dominant monetization model shaped by user expectation, platform dynamics, and the underlying psychology of why people use that type of app at all. Fight your category's default model and no amount of A/B testing on price or copy fixes it because you're optimizing the wrong layer.
If you think that subscription is the only monetization model that works across non-gaming, think again. For all its momentum, subscription still isn't the dominant force in app monetization overall. Yes, its share of total app revenue nearly doubled in fifteen months from 4% to 7%, while advertising compressed from 63% to 57% - and that's real growth. But it's also proof that subscription's dominance is a category-specific story, not a category-wide one. In Health & Fitness, it's close to everything. In Social Networking, it's close to nothing. The category decides.
Looking at OS matters, too. The App Store generated $117B in 2025 against Google Play's $49B, despite Android holding 68% of global OS share. That imbalance plays out differently in every category: sometimes it's a revenue split, sometimes a conversion gap, sometimes close to irrelevant.
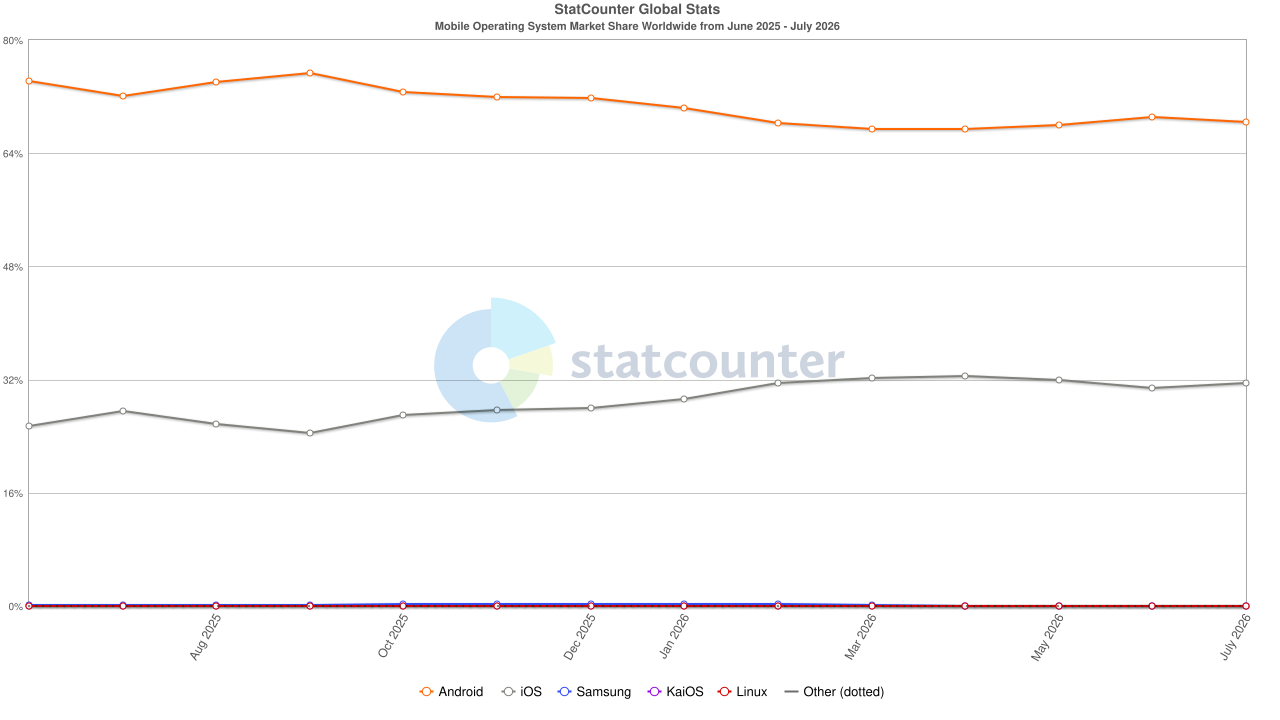
Source: https://gs.statcounter.com/os-market-share/mobile/worldwide
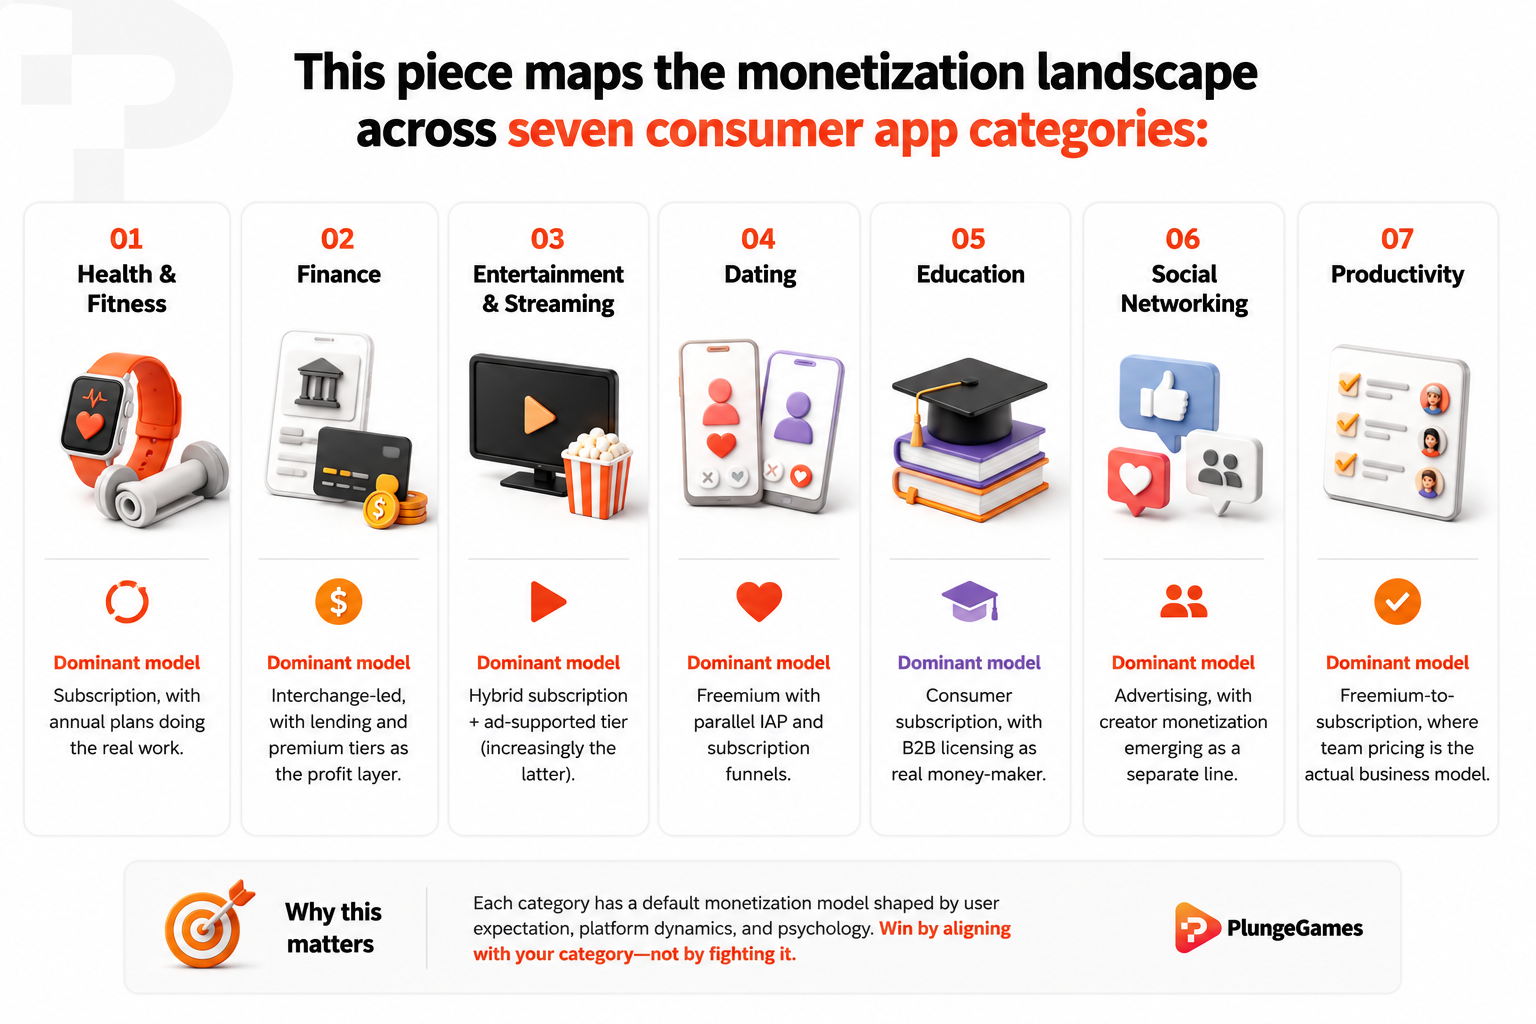
This piece maps the monetization landscape across seven consumer app categories:
Health & Fitness: subscription, with annual plans doing the real work
Finance: interchange-led, with lending and premium tiers as the profit layer
Entertainment & Streaming: hybrid subscription + ad-supported tier (increasingly the latter)
Dating: freemium with parallel IAP and subscription funnels
Education: consumer subscription, with B2B licensing as real money-maker
Social Networking: advertising, with creator monetization emerging as a separate line
Productivity: freemium-to-subscription, where team pricing is the actual business model
For each, we’re exploring the dominant monetization model, how it plays out across iOS and Android, and one operator-level tip specific enough to test this week.
1. Health & Fitness: Explore annual subscriptions
Health & Fitness is the category that proved subscription could work at scale in consumer apps by getting users to commit annually before the habit breaks.
The category generated ~$6B in revenue in 2025, up 17% YoY. Subscription accounts for roughly 80% of that, with annual plans capturing 59% of subscription revenue in the category. The mechanism that makes annual work is presentation, not price. 67% of health app subscribers choose the annual plan when it's shown as a monthly equivalent, rather than as a lump sum: "just $5.83/month, billed annually."
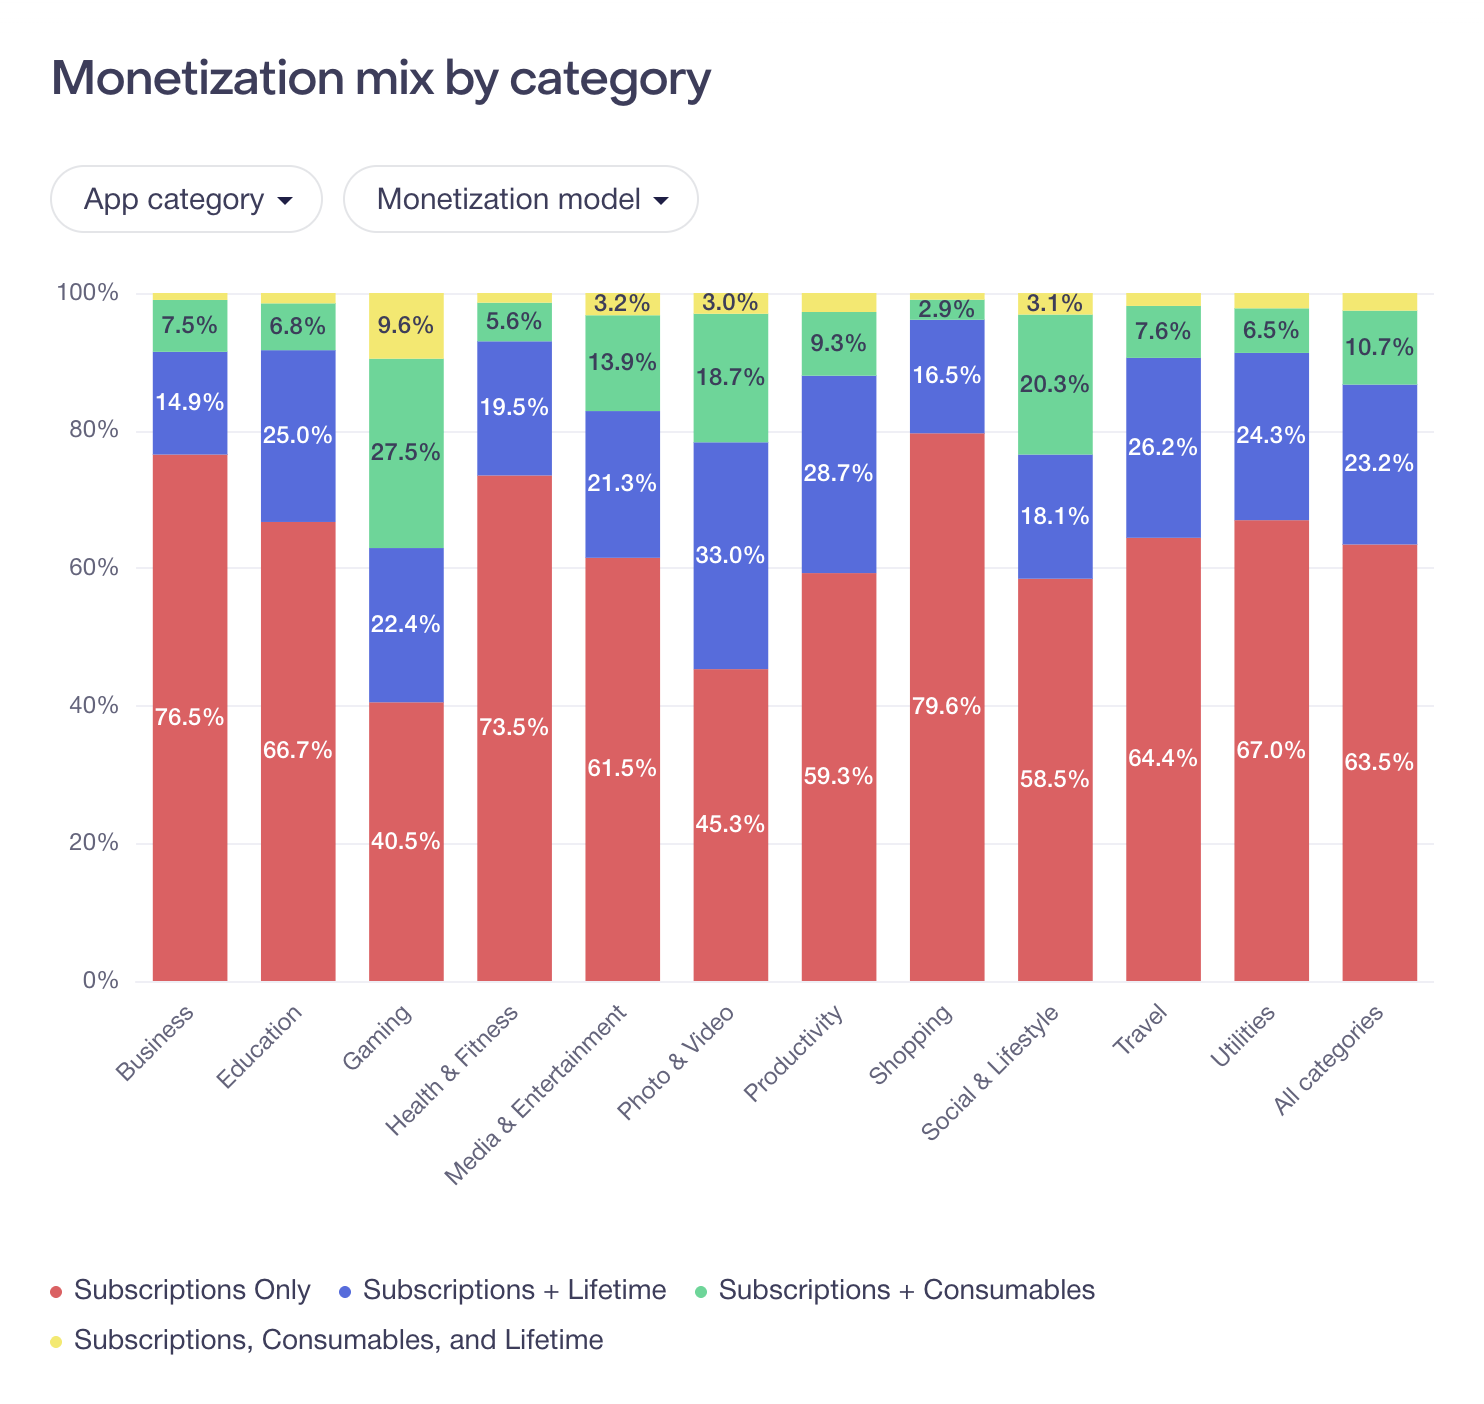
Source: https://www.revenuecat.com/state-of-subscription-apps/
One thing to keep in mind: this is a category where power law is in play. The top 10% of Health & Fitness apps capture 92.6% of all category revenue. It doesn’t mean smaller players can’t enter the game and succeed; it just means they need to be able to compete on annual plan conversion rates.
iOS vs. Android
The subscription model that dominates on iOS is harder to replicate at the same rate on Android. App Store trial-to-paid conversion in Health & Fitness sits at 44.5% - third highest of any category. Play Store trial conversion overall runs 28.5%, compared to the App Store’s overall trial CVR of 39.0%. That gap changes how the paywall should be sequenced on each platform.
Operator tip
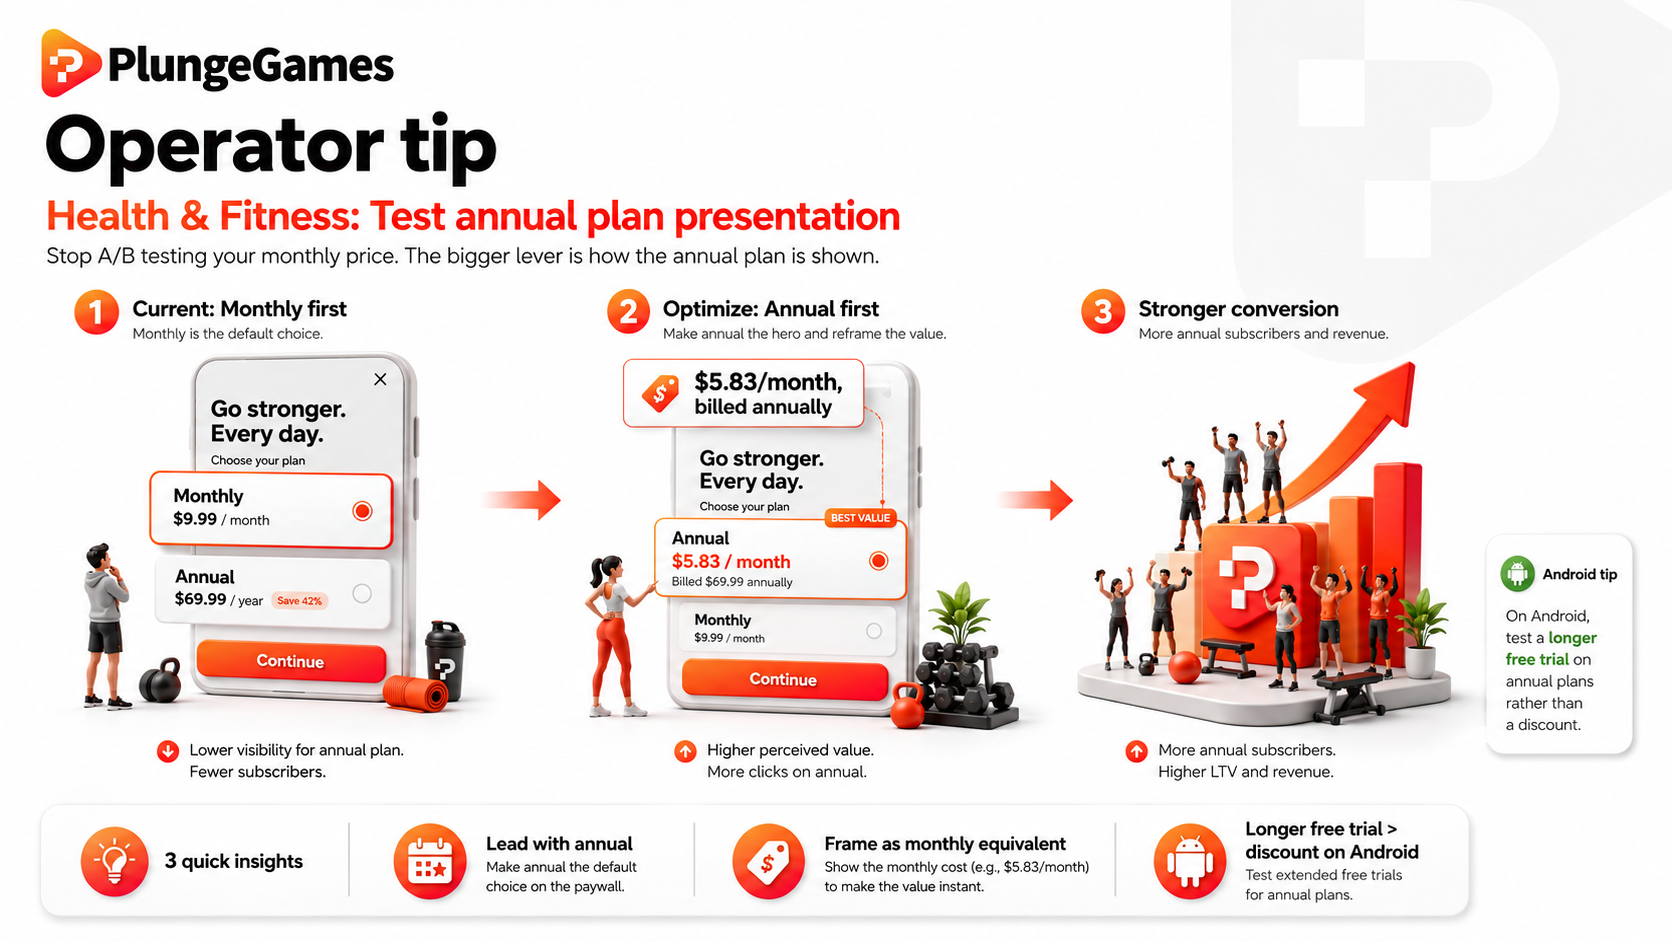
Test conversions from monthly to annual plans with these two initial A/B tests:
Raise your monthly price. Making the annual plan look cheap by comparison to the monthly rate is often the nudge that flips CVR in favor of annual
Show the annual plan first, framed as a per-month cost. Placement alone can make a difference, then phrasing it as a lower monthly cost ("$5.83/month, billed annually") helps people see it as a real deal and convert
2. Finance: Diversify beyond interchange revenue
Neobanks, tech companies that provide banking services through a partnership with an established bank, rather than holding their own banking license, are a major sub-category in finance where the monetization strategy shows up clearest. They generated $39.5B in revenue in 2024, with Nubank alone accounting for over a quarter of that total. By that measure, it appears as though neobanks cracked consumer app monetization. Free accounts, no fees, tens of millions of users, tens of billions in revenue.
Yet 76% of neobanks globally remain unprofitable. The math explains why. A user who puts $1,000 a month on their card nets the neobank a little over $4 in interchange (the per-transaction fee card networks pay to the card-issuing bank, a share of which flows to the neobank), even at a favorable small-issuer rate. That covers basic account infrastructure. It doesn't cover the three things a scaling neobank actually needs money for:
Growth spend
Compliance headcount
Support
Interchange is what gets a neobank to scale. Lending, deposits, and premium tiers get it to profit.
That’s shown in how some of the top finance apps are driving revenue by expanding beyond interchange:
Chime's S-1 shows that interchange made up roughly 72% of total revenue in Q1 2025, down from a higher share in 2024 as the company pushed platform products like earned-wage access
Revolut's 2025 financials show $936M in subscription revenue, proof that a premium tier can become a real second leg
Nubank has been profitable since Q1 2023, with FY2025 revenue of $16.3B - up 45% YoY - and $2.9B in net income, built on interchange plus lending at scale
iOS vs. Android
Finance ranked #3 by downloads in 2025 but generated only about 0.3% of total app revenue. Neither Apple nor Google applies standard commission fees to financial services apps, and the real revenue in this category doesn’t flow through store billing. It flows through card networks, loan books, and deposit spreads. In this category, your users’ OS doesn’t matter as much.
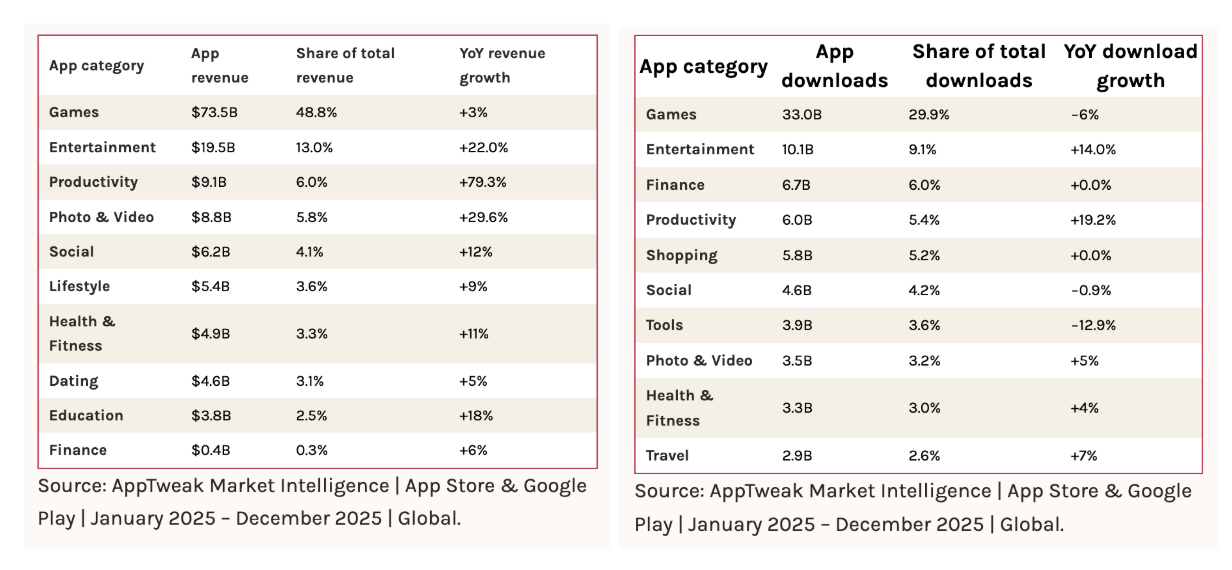
Source: https://www.apptweak.com/en/reports/app-market-size-by-app-category
Operator tip
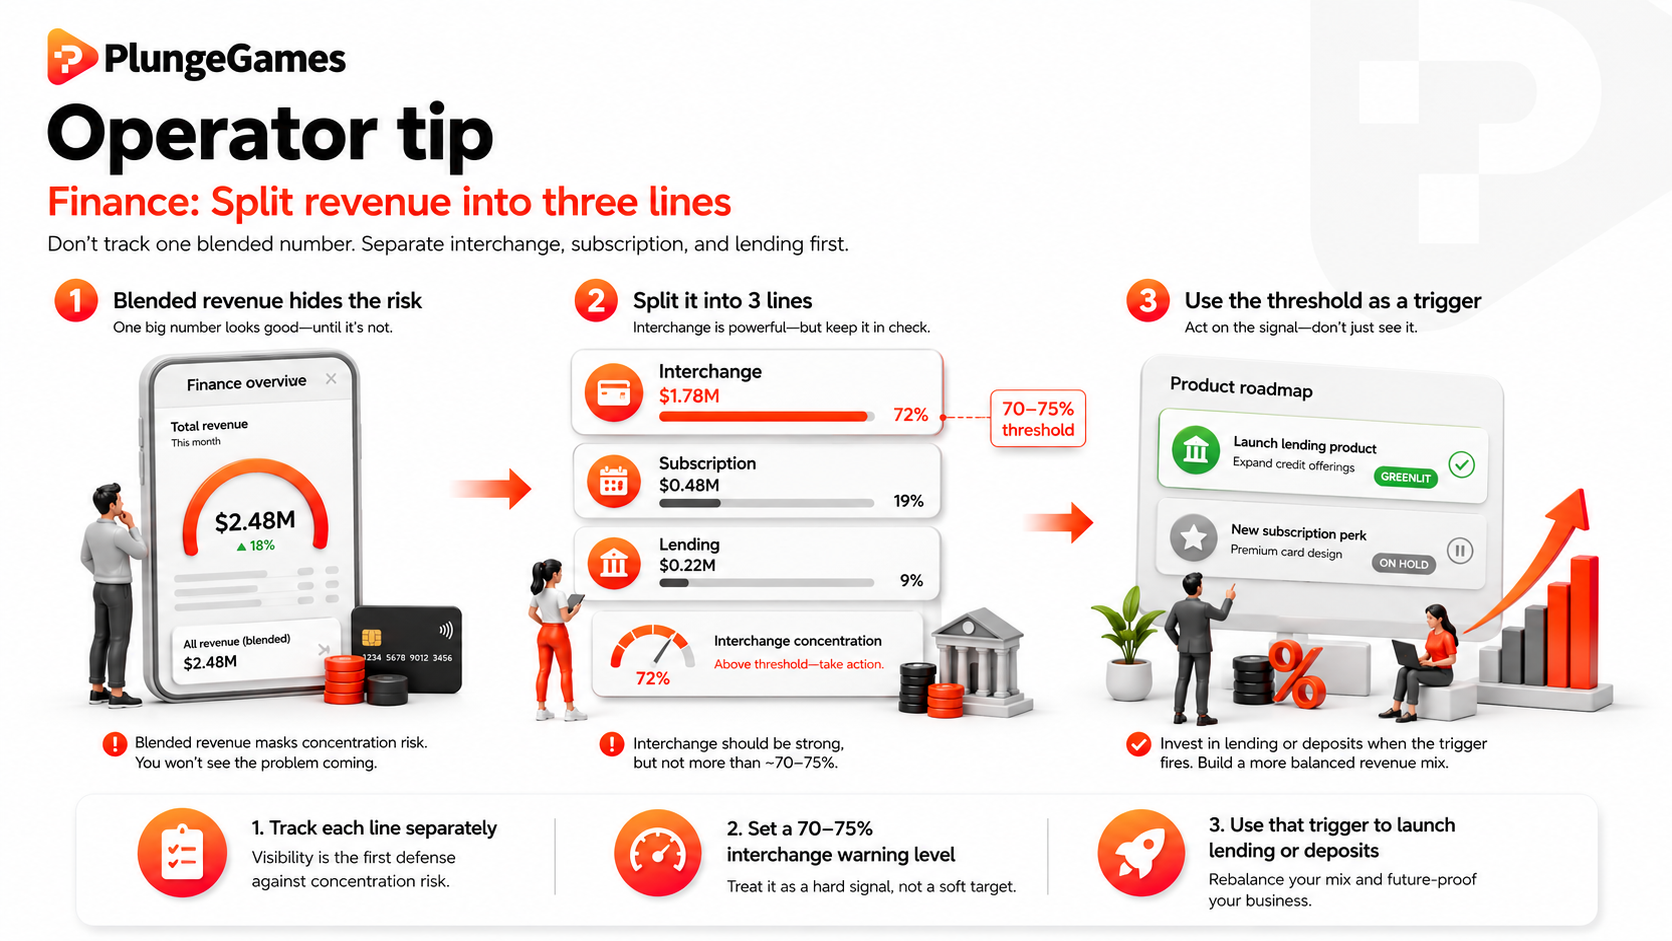
Split your revenue into three lines, instead of tracking one blended number:
Interchange
Subscription
Lending
Calculate what percentage comes from interchange alone. If it's above roughly 70–75%, treat that as a warning sign: a single regulatory change or partner-bank decision can hit nearly all of your revenue at once. Set that threshold now, before your next roadmap cycle, as the trigger for greenlighting your first lending or deposit product instead of another subscription feature.
3. Entertainment/Streaming: Introduce an ad-supported tier
For a decade, streaming's pitch was simple: pay us instead of watching ads. That pitch is now inverted.
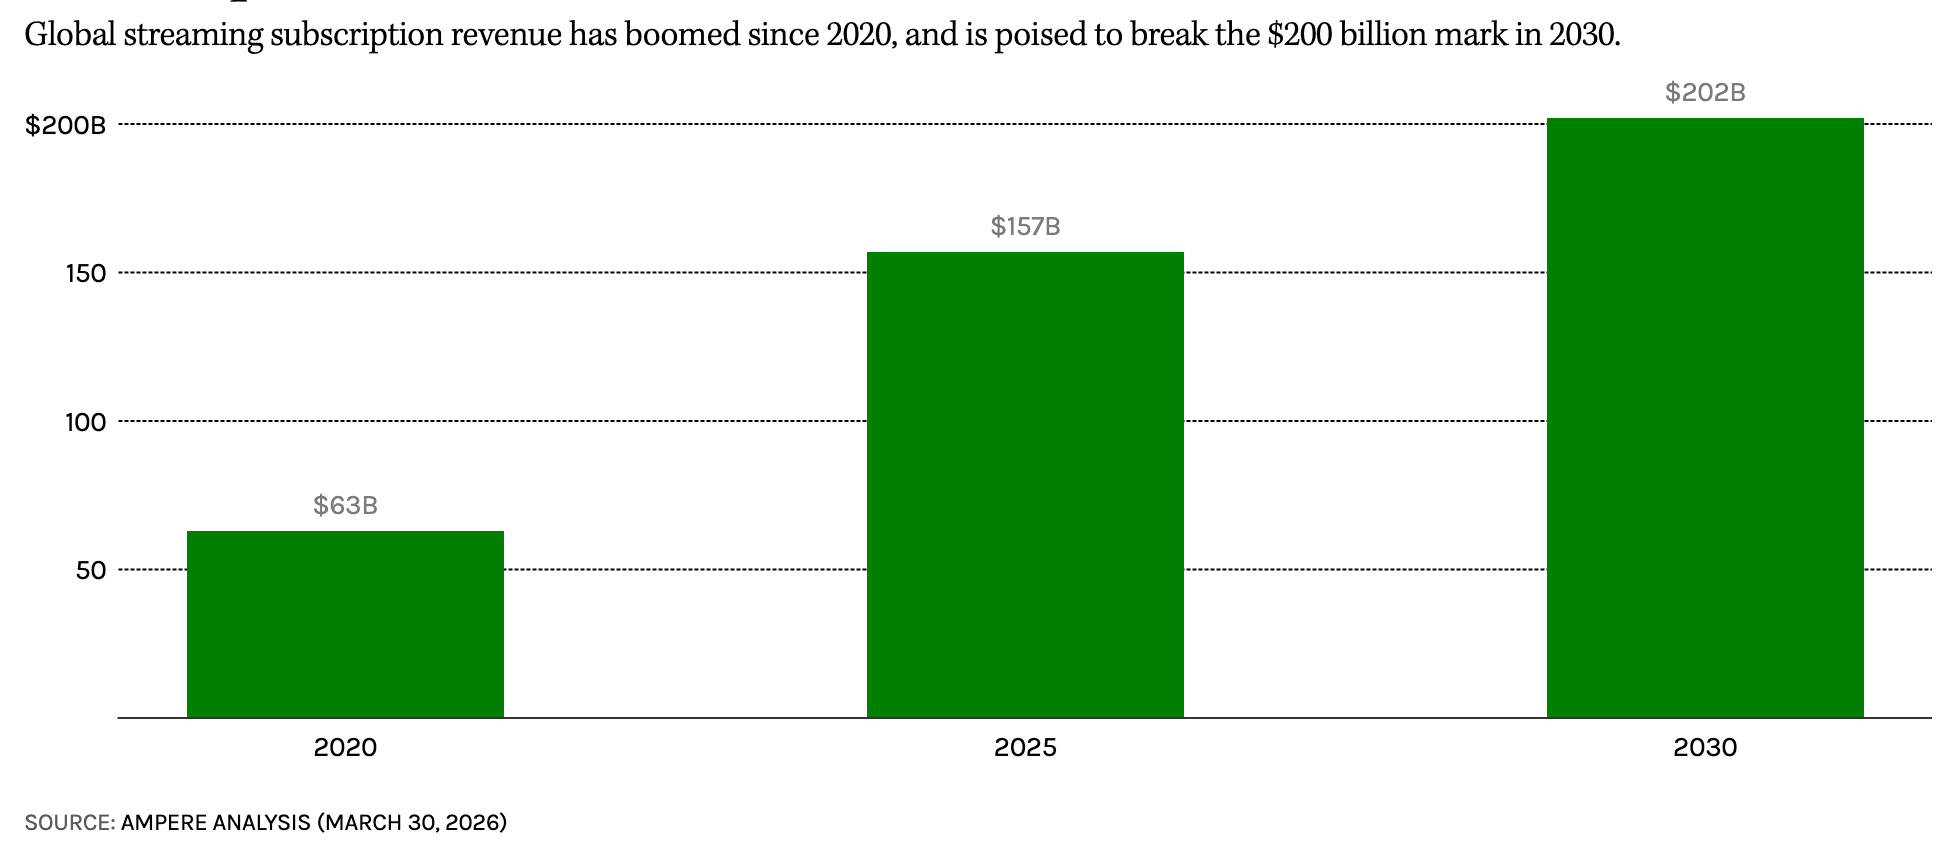
Global streaming revenue hit $177B in 2025, with $157B coming from subscriptions and $20B from advertising. Ad-supported tiers now making up 28% of global streaming subscription revenue - that’s a a 460% increase since 2020.
Netflix is one of the clearest examples of what this shift looks like at scale. Their ad revenue grew more than 2X year-over-year, with 2026 guidance targeting around $3B - up from roughly $1.5B in 2025. In 2026, they surpassed 250M monthly active viewers on their ad-supported tiers. Though growing, advertising is still a small share of Netflix's total business. The company's ad revenue represents about 3.3% of 2025's $45.18B total revenue, rising to roughly 6% if 2026 guidance holds.
The shift is visible outside traditional streaming too. Microdrama apps, like ReelShort, DramaBox, and ShortMax, represent a $14B market that built its monetization on a pay-to-unlock model: watch a few free episodes, hit a paywall at the cliffhanger, then buy currency or wait out a rewarded ad. In China, paid-unlock accounted for 70% of that market's share of voice in 2023. By 2025, free-with-ads had overtaken it at 66%.
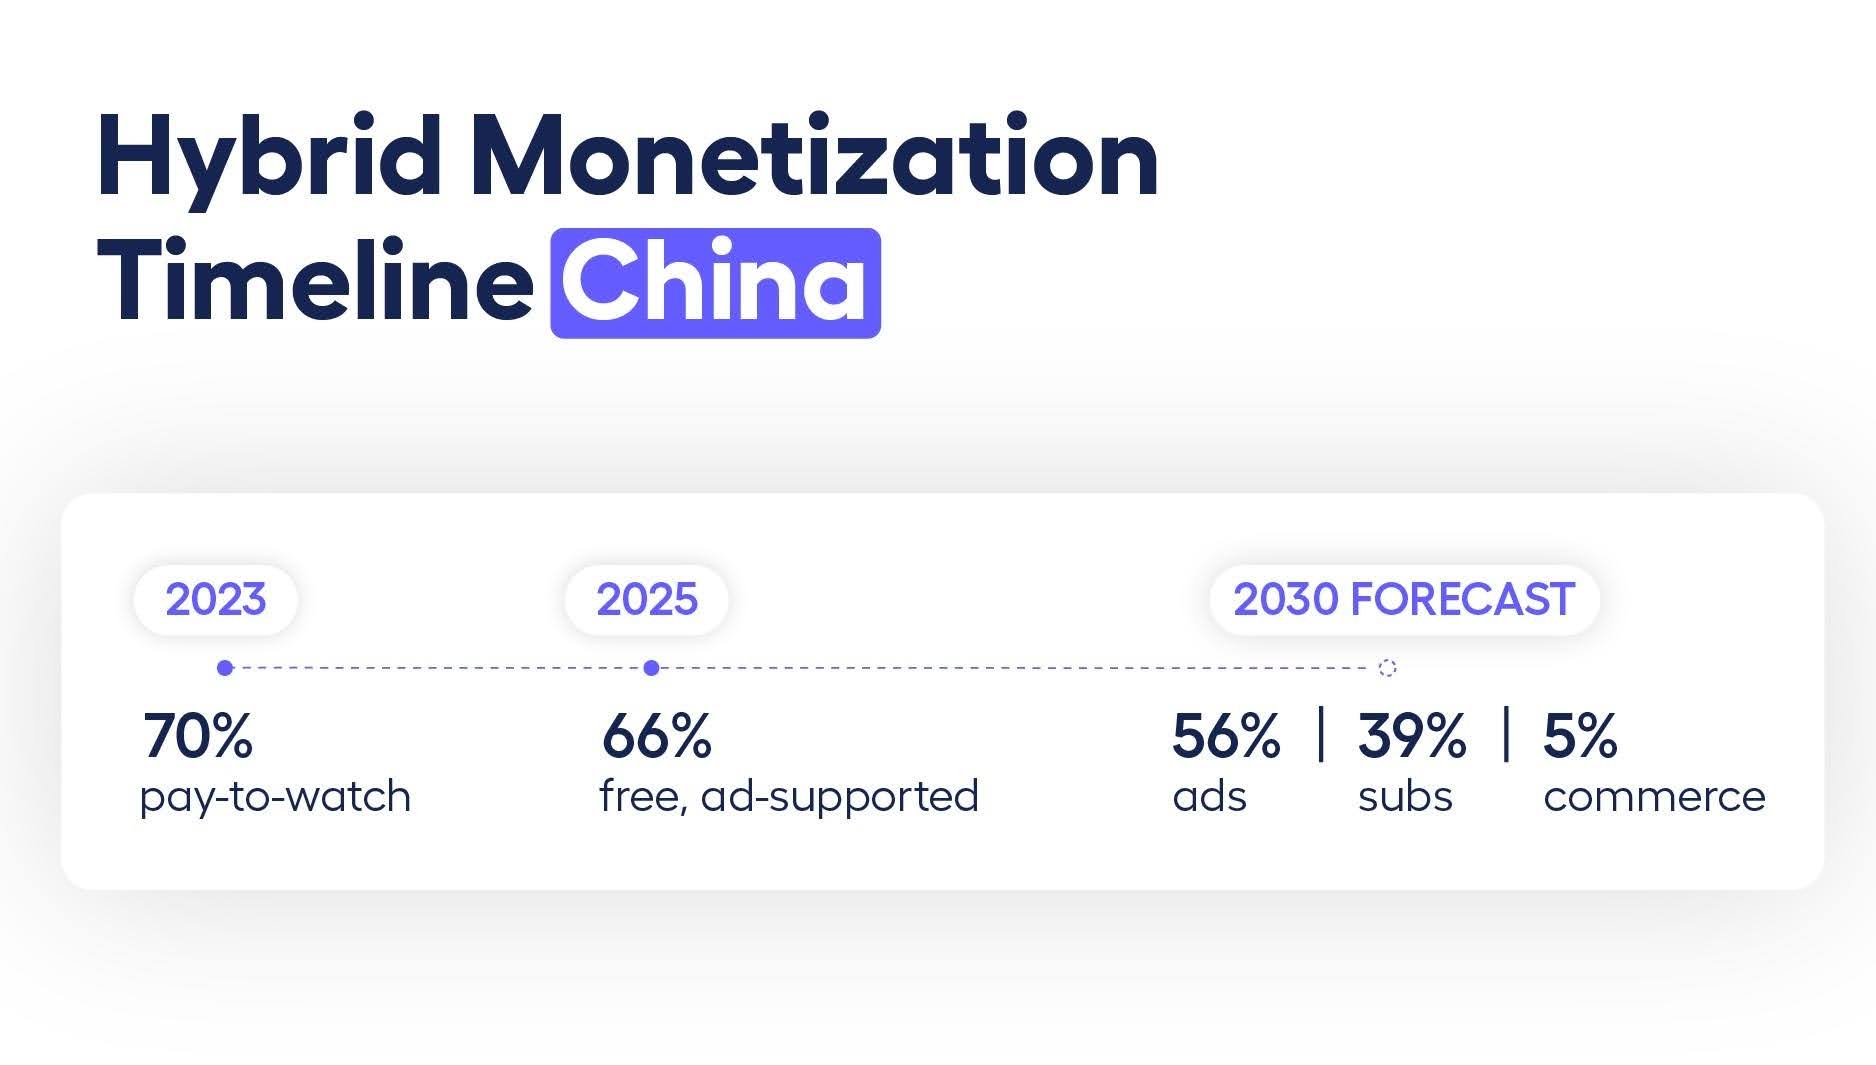
Source: https://adjoe.io/blog/short-drama-apps-rewarded-engagement/
iOS vs. Android
The OS differences in entertainment/streaming apps come down to platform policy, since both stores have streaming billing exemptions.
Apple's "Reader Apps" policy (Guideline 3.1.3(a)) lets video-streaming apps skip in-app purchase billing entirely. That’s how a service like Netflix avoids Apple's commission on subscriptions sold outside the app. Google's exemption is narrower: it only waives Play Billing when a subscription runs through a carrier or an existing cable/satellite plan, not as a general content exemption.
That means the same streaming app can structure its iOS subscription flow to route around Apple's cut entirely, while its Android flow may still owe Google a commission unless it qualifies for the carrier-tied waiver specifically.
Operator tip
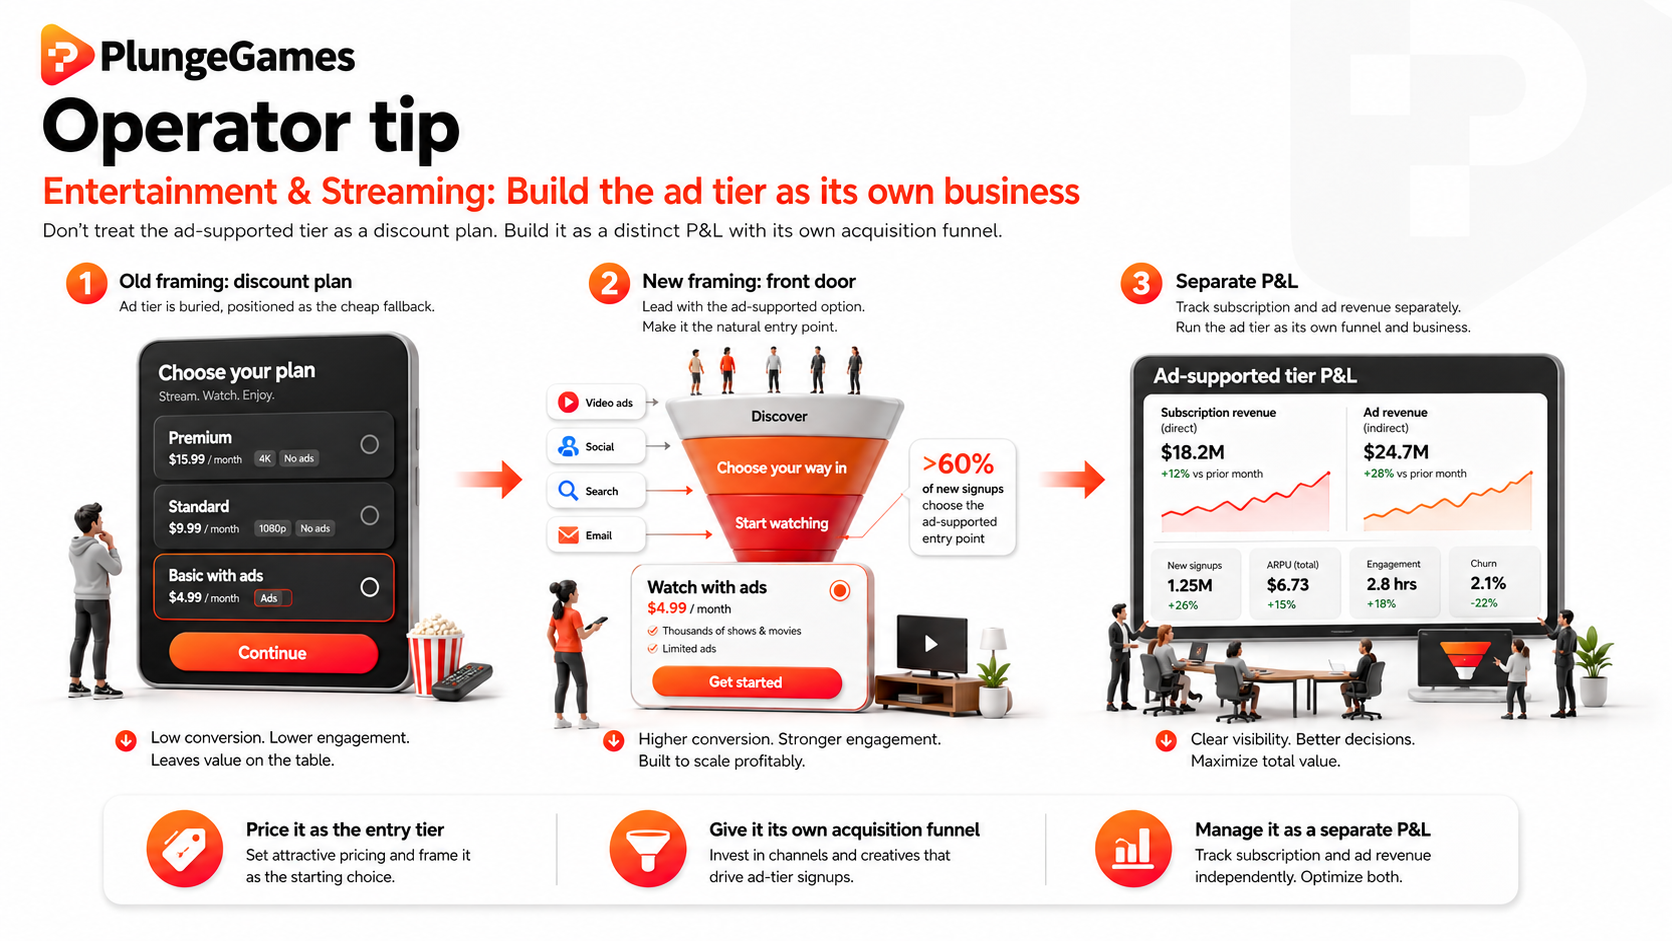
Don't build your ad tier as a discount plan for users who won't pay full price. Build it as a distinct P&L with its own acquisition funnel.
Netflix now gets more than 60% of new signups opting into ad-supported plans. For most new users, the ad tier is the front door. Price and market it as the default entry point, not a retention offer buried in your cancellation flow.
4. Dating: Run two monetization funnels
Dating apps run a hybrid model: free core swiping, paid subscriptions for unlimited likes, and a la carte consumables (e.g. boosts and super likes) for impulse spend. That structure hasn't changed. What did change was that in 2025, users began engaging more with apps that focused on real relationship-building - not just swiping.
Hinge grew revenue by 26% and paying users by 17% in 2025, while charging nearly 2x what Tinder charges per paying user. Hinge's revenue per payer in Q4 2025: $32.96. Tinder's: $17.63. Furthermore, Tinder's Q4 2025 payer count dropped 8% to 8.8M, with full-year direct revenue down 4% to $1.9B.
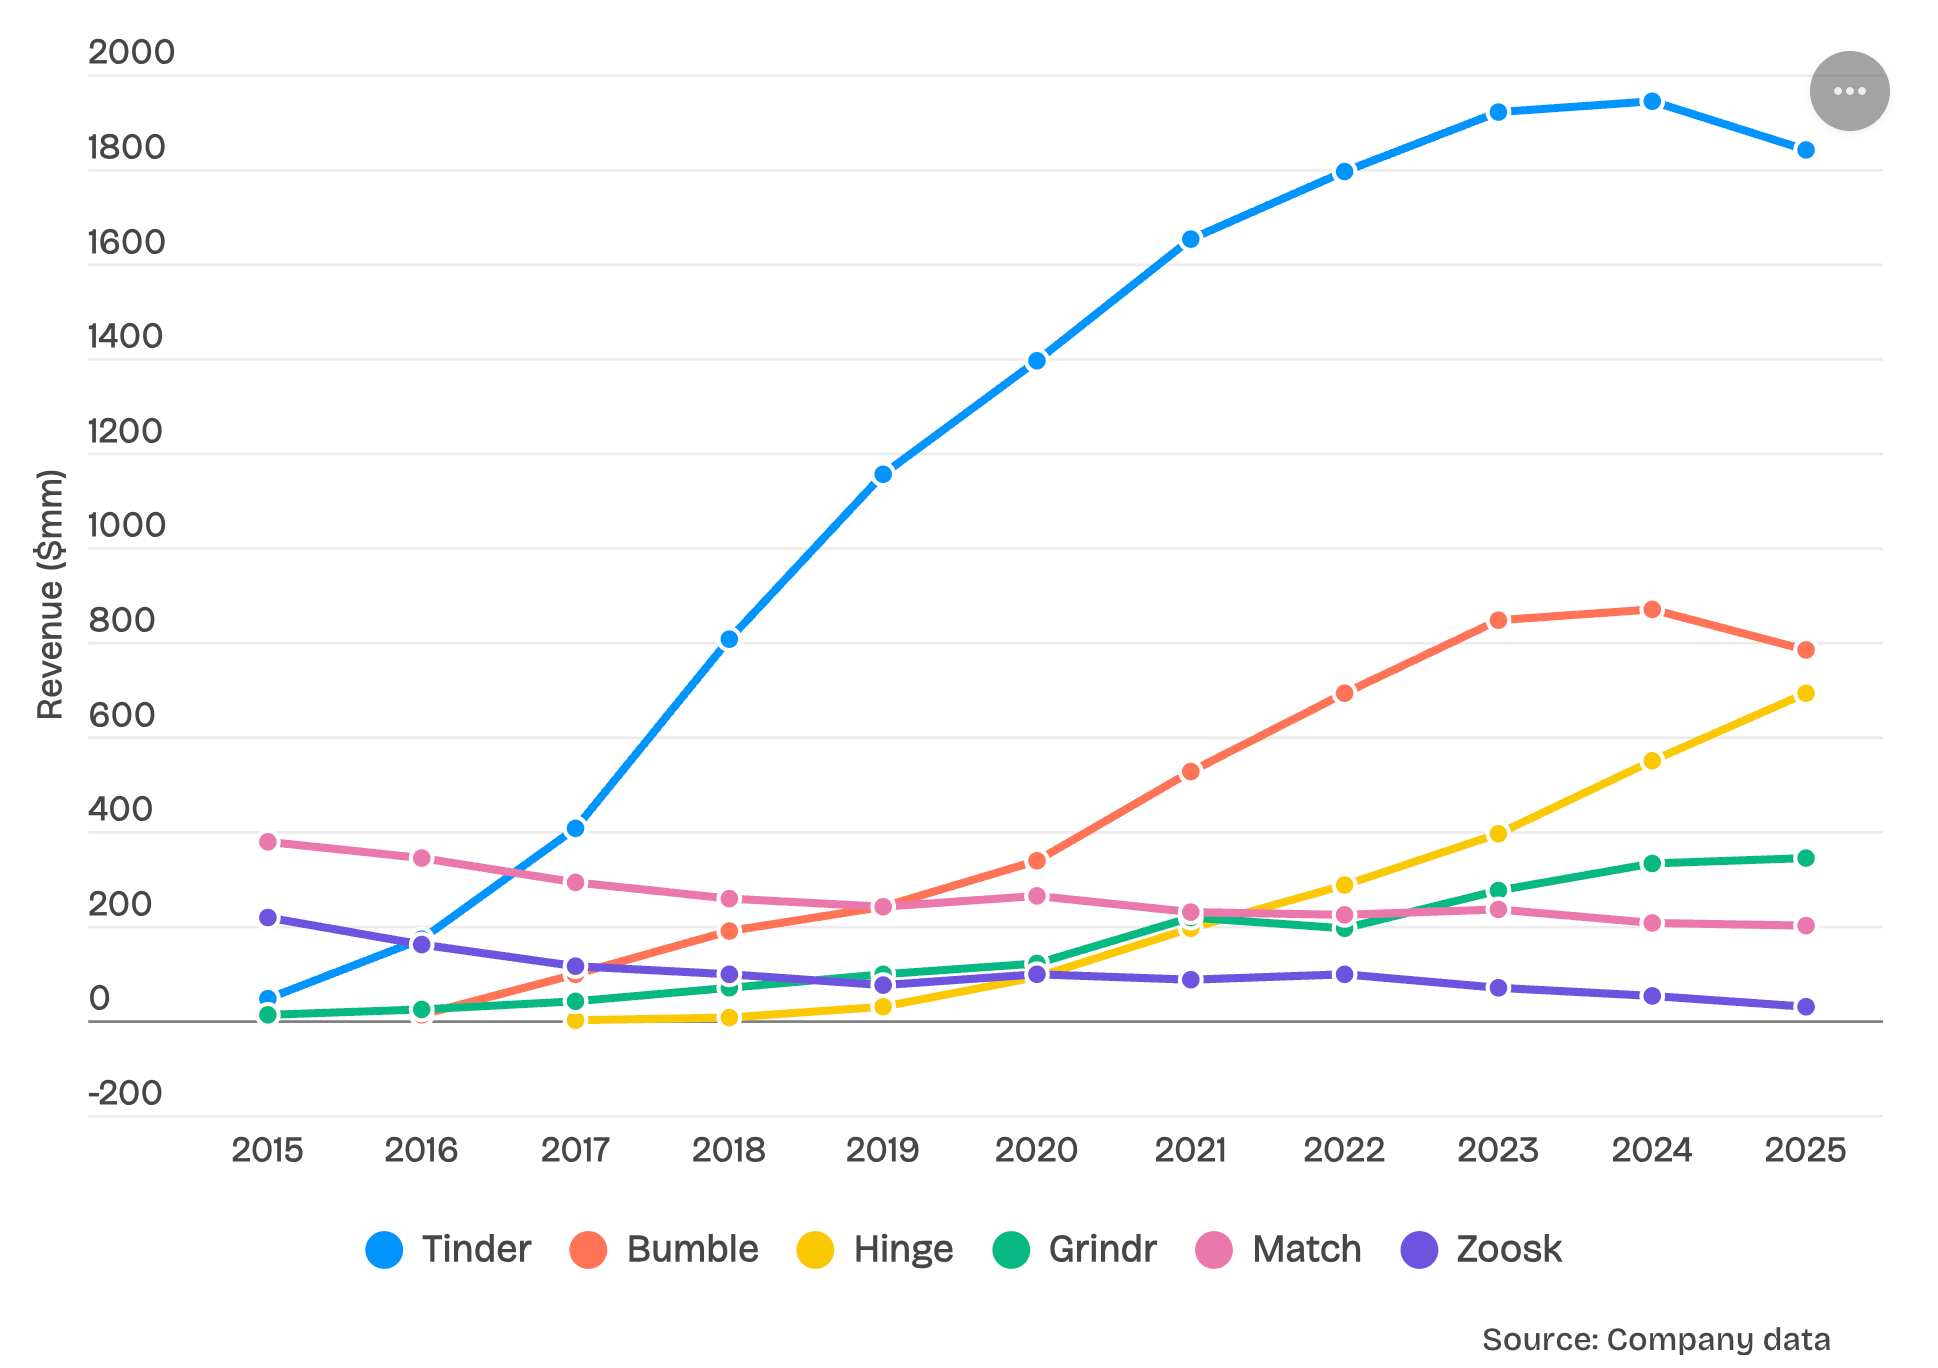
Source: https://www.businessofapps.com/data/dating-app-report/
What separates them isn't the model - both run subscription plus IAP. It's product positioning. Hinge's higher-intent, relationship-focused framing supports a narrower but more valuable user base.
iOS vs. Android
Dating skews harder toward iOS than almost any other category, driving roughly 80% of the mobile revenue. This changes where you should run your pricing tests before you roll them out everywhere. A paywall or tier experiment that works on iOS tells you more about your actual monetization ceiling than the same test run on Android, simply because that's where most of the category's paying behavior already concentrates. Test there first, and treat Android results as a secondary signal, not a parallel data point carrying equal weight.
Operator tip
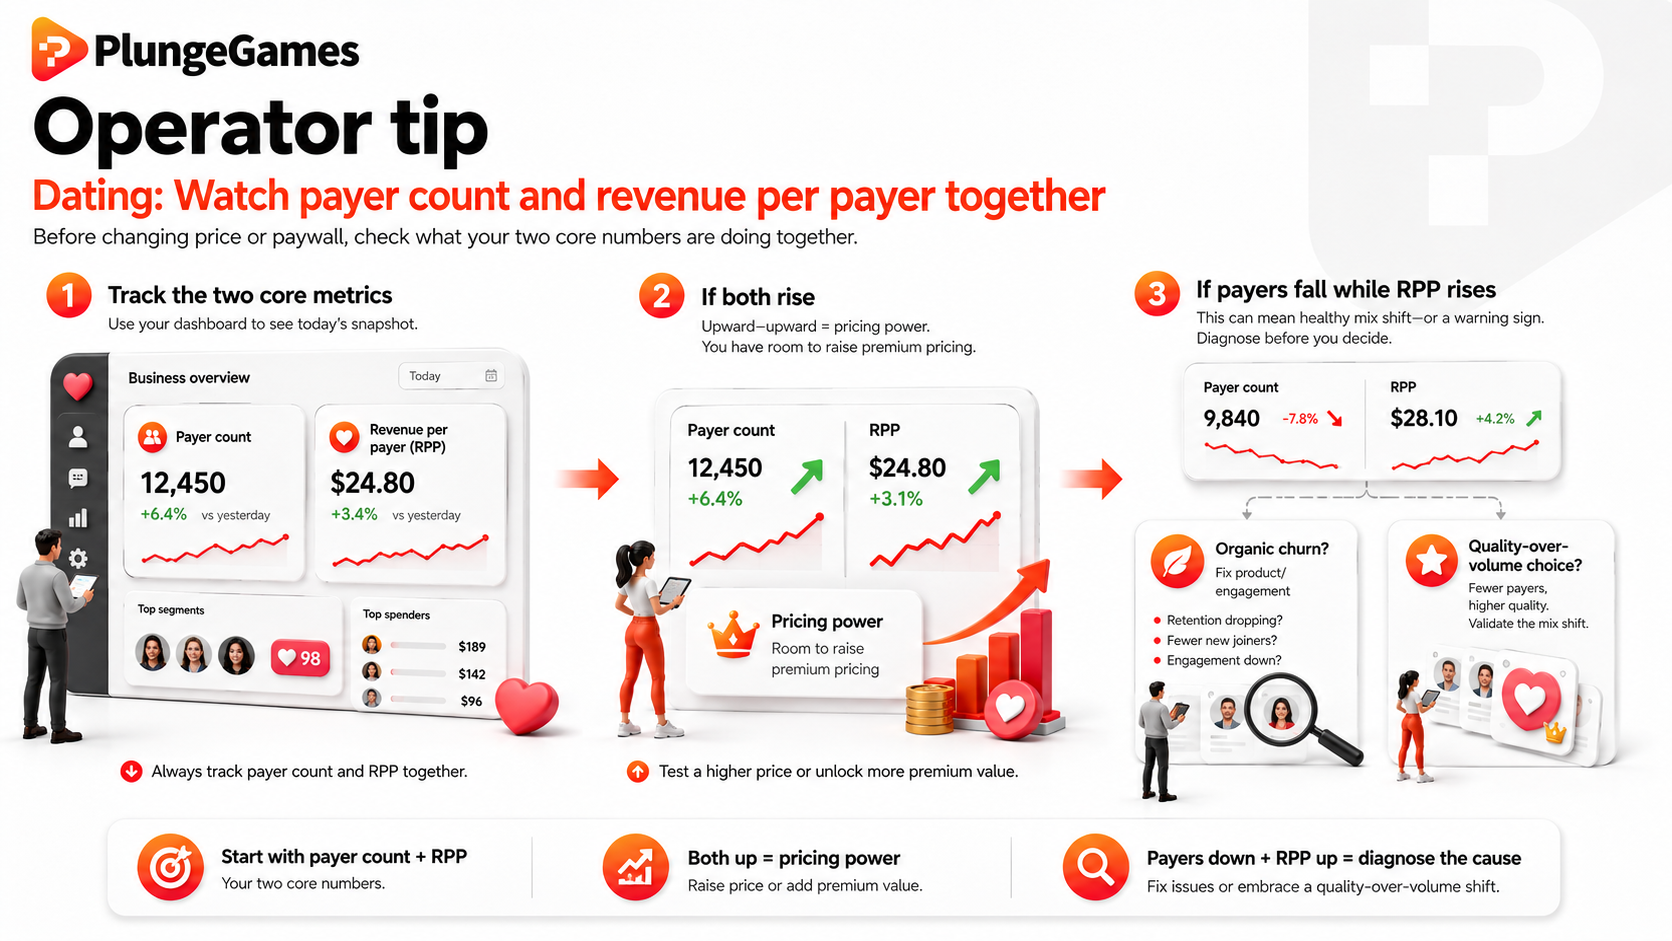
Before touching your paywall or pricing, check which direction your two core numbers are moving together: payer count and revenue per payer.
If both are climbing, the position Hinge is in, you have real pricing power and room to keep raising premium tier prices.
If payers are shrinking while RPP rises, check whether it's organic churn (fix product and engagement before touching price) or a deliberate quality-over-volume choice. The latter is what Bumble did: Bumble's paying users fell 20.5% in Q4 2025, but that was mostly due to their deliberate choice to cut performance marketing spend by more than 80% and reset its user base quality.
5. Education: Expand to B2B buyers
The common assumption is that education apps grow on consumer subscription and eventually unlock bigger, more durable revenue through school or enterprise licensing. The reality is more conditional: institutional revenue is real and can become a meaningful share of the business, but only for companies that build and price it as an actual paid product from day one. May sound obvious, but Duolingo - one of the biggest names in education apps - gave its school-facing product away free for a decade. It's shutting down in 2027 for insufficient usage.
Consumer subscriptions can still drive significant revenue. Duolingo's Q1 2026 revenue hit $292M, up 27% year-over-year. Subscriptions drove $250.9M of that revenue, making up 86% of the total - up 31% YoY). And Coursera's Enterprise segment is growing slower than Consumer right now, up only 6% YoY with net revenue retention down to 89%.
Switching to the B2B side, Franklin Covey's Education Division ("The Leader in Me") shows what committed institutional pricing looks like: deferred subscription revenue is up 21% YoY in May 2025. And Nerdy Inc. (Varsity Tutors) discloses Institutional revenue as its own line, driving $7.3M, or 16% of total company revenue, in Q2 2025. Both treat institutional revenue as a distinct product that requires its own sales motion, pricing, and relationship infrastructure.
iOS vs. Android
The store split here comes down to where the money actually concentrates, not where the downloads do. Google Play has more education apps than iOS and sits as the #1 category on Android, but the App Store wins on monetization despite being only the 4th largest category on iOS. One estimate puts iOS revenue per download running about 2.3x higher than Android's, consistent with the higher purchasing power of its user base in North America, Western Europe, and premium Asian markets.
That means an install-volume strategy built around Android will grow your user base faster. But you should still build and measure a monetization strategy - pricing tests, paywall experiments, premium tier design - primarily through iOS results.
Operator tip
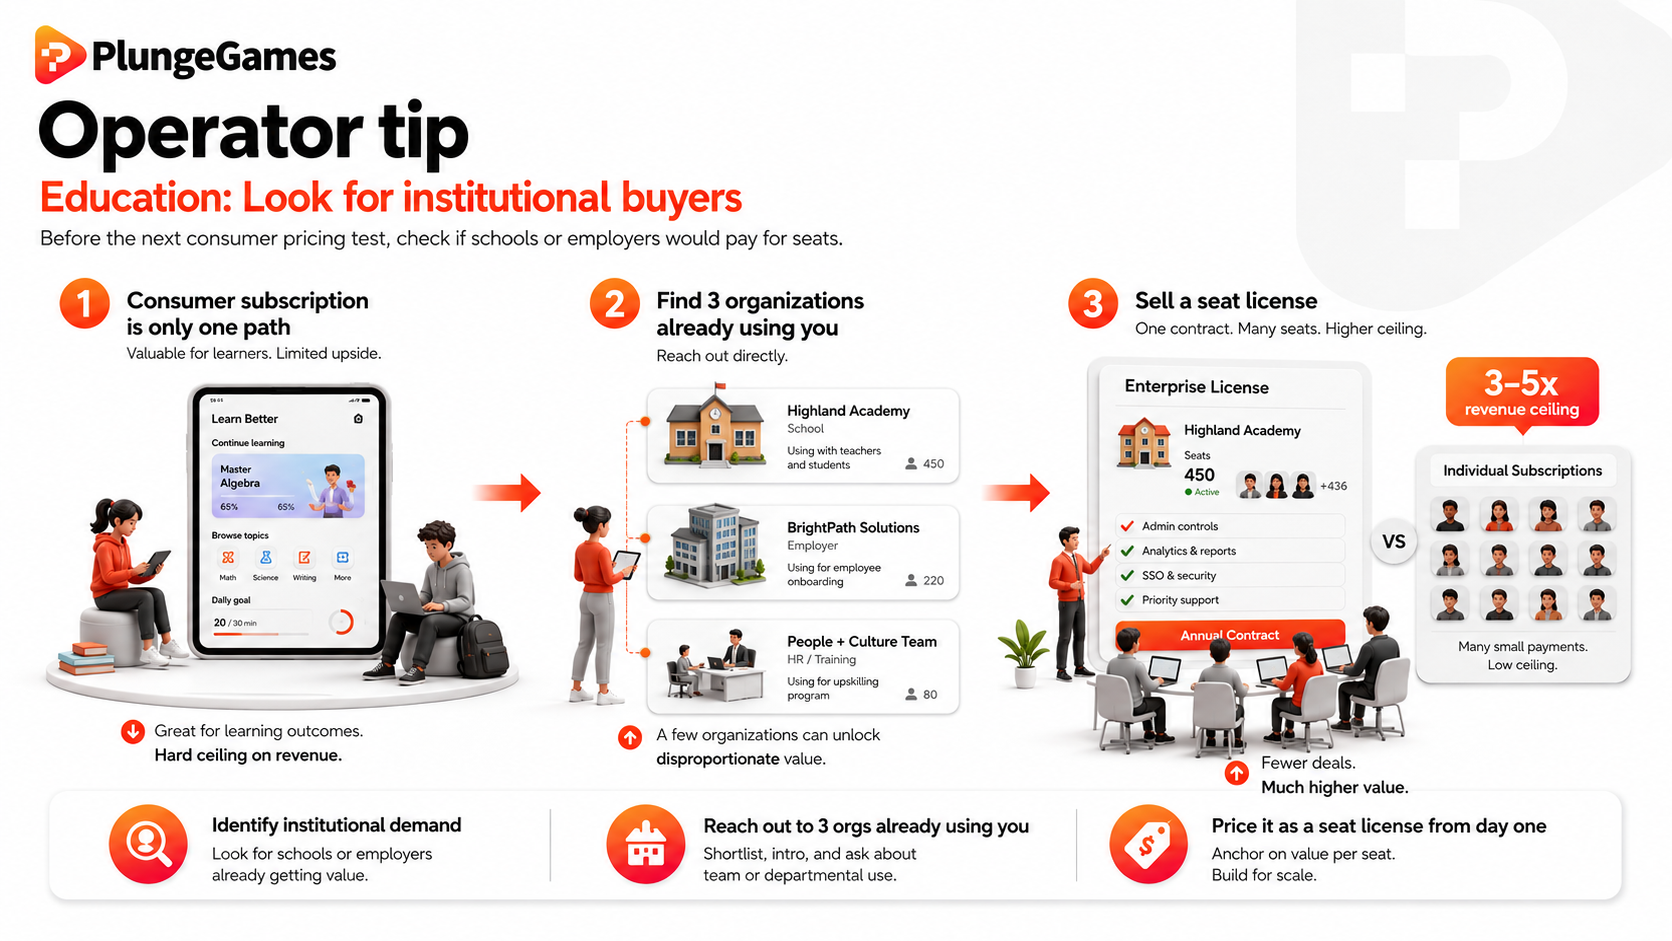
Before your next consumer pricing test, check whether your content has institutional buyers. If your app teaches something a school, employer, or HR team would pay for, you may have a B2B licensing opportunity worth 3-5x the revenue ceiling of your consumer subscription.
Identify 3 organizations whose employees or students already use you, reach out directly, and price it as a seat license from the start. One enterprise contract often equals hundreds of individual subscriptions, but only if it's priced as a product, not given away as a growth tactic the way Duolingo's school product was.
6. Social networking: Complement ads with creator monetization
Creator monetization and non-advertising revenue are both growing inside social platforms. Both things are true at once: creator and subscription monetization is expanding fast, and advertising remains, by a wide margin, the actual business.
Social networking apps generated an estimated $134.4Bin mobile ad revenue in 2024, which is more than mobile games pulled in from ads that same year. And social networks account for over 72% of all US digital ad spend, with Meta's Facebook and Instagram alone capturing nearly half of that total.
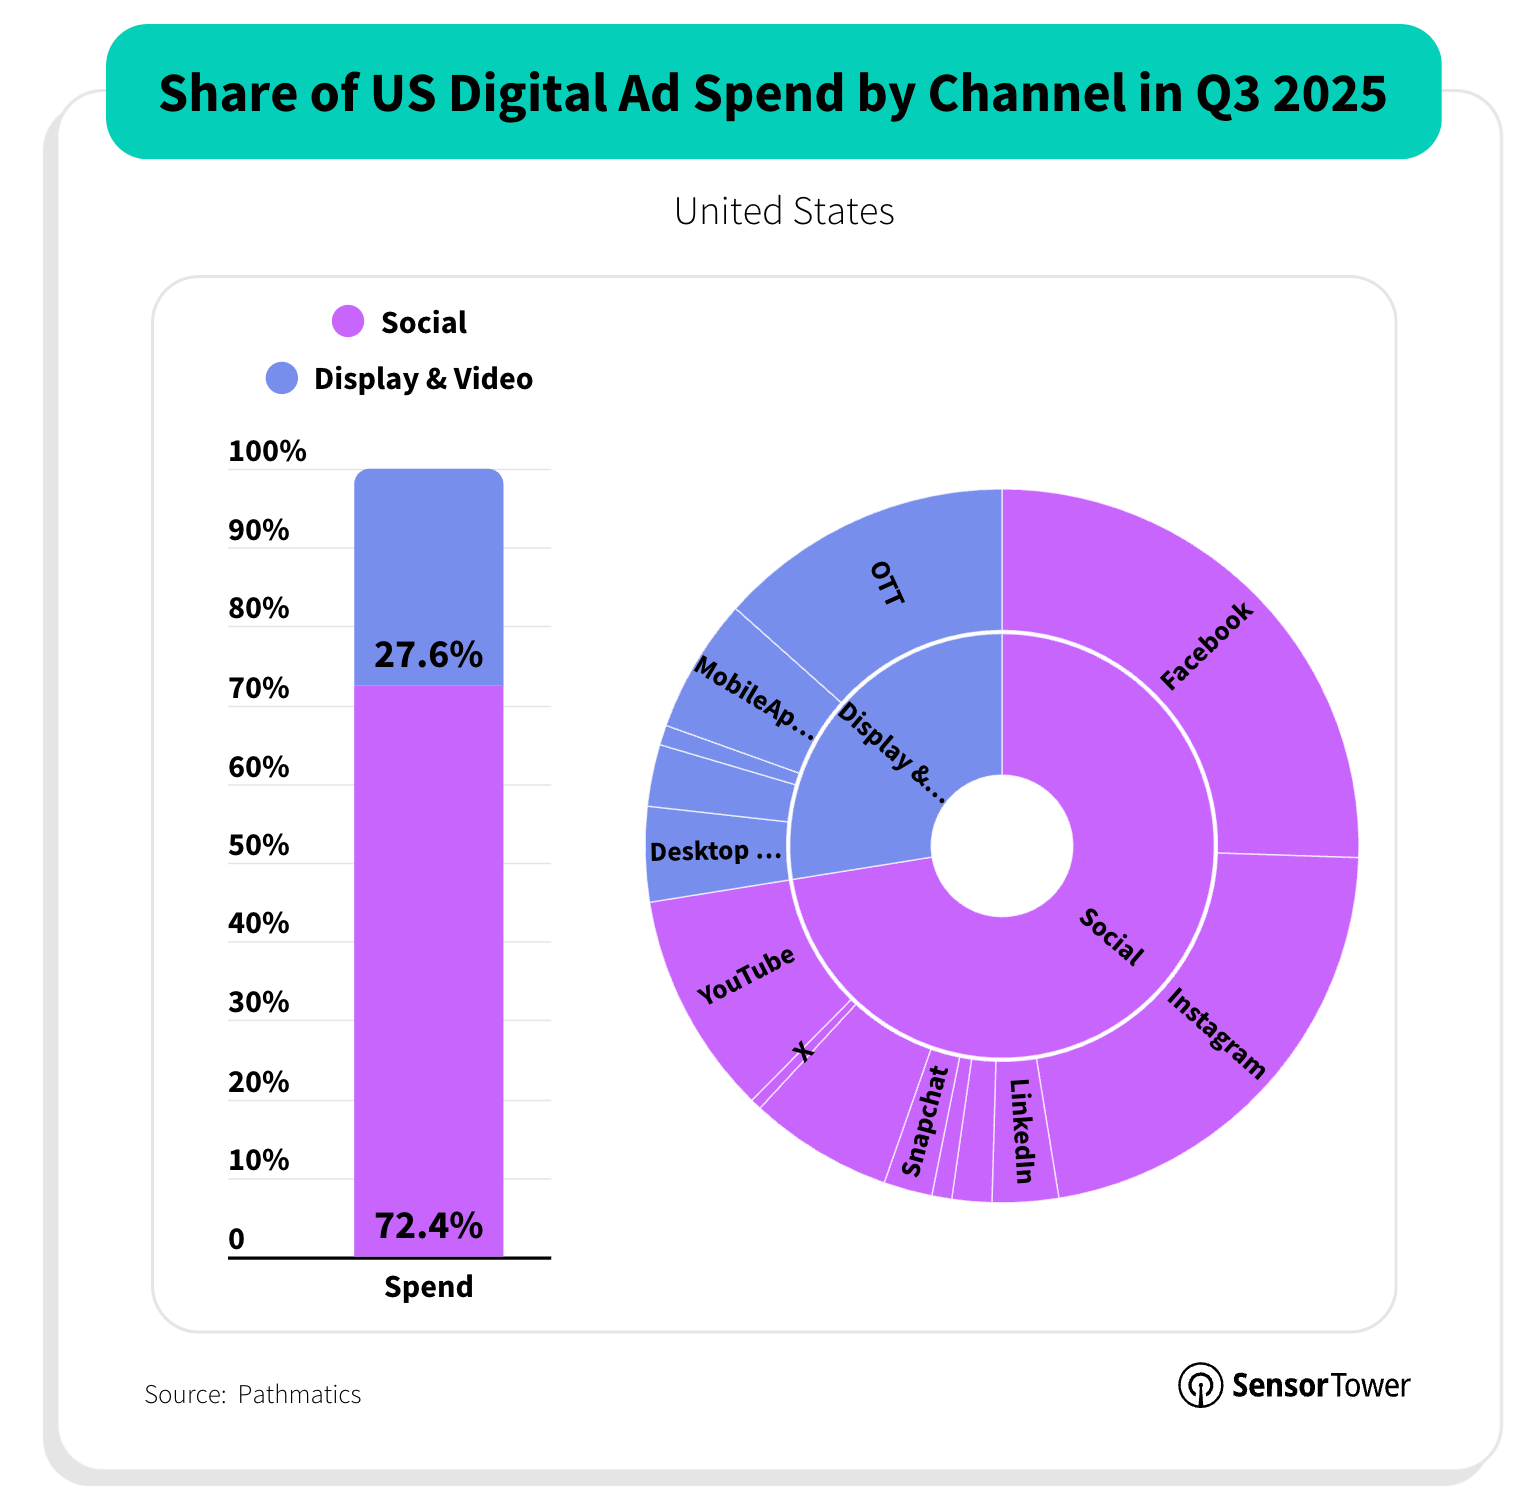
Source: https://sensortower.com/blog/q3-2025-digital-market-index
Against that, social apps generated $12.9B in global in-app purchase revenue - virtual gifts, tips, and subscriptions - in 2025, up 17% YoY. YouTube even paid creators, artists, and media companies $100B since 2021. That's real growth, but it's less than 10% of what advertising generates.
Creative monetization revenue usually comes from a few different sources:
Ad revenue share (YouTube Partner Program, Meta's Content Monetization Program)
Fan funding and virtual gifting (Stars, Coins, Bits)
Subscriptions and memberships (Channel Memberships, Twitch Subs)
Commerce and affiliate (TikTok Shop, YouTube Shopping)
Brand deals and sponsorships
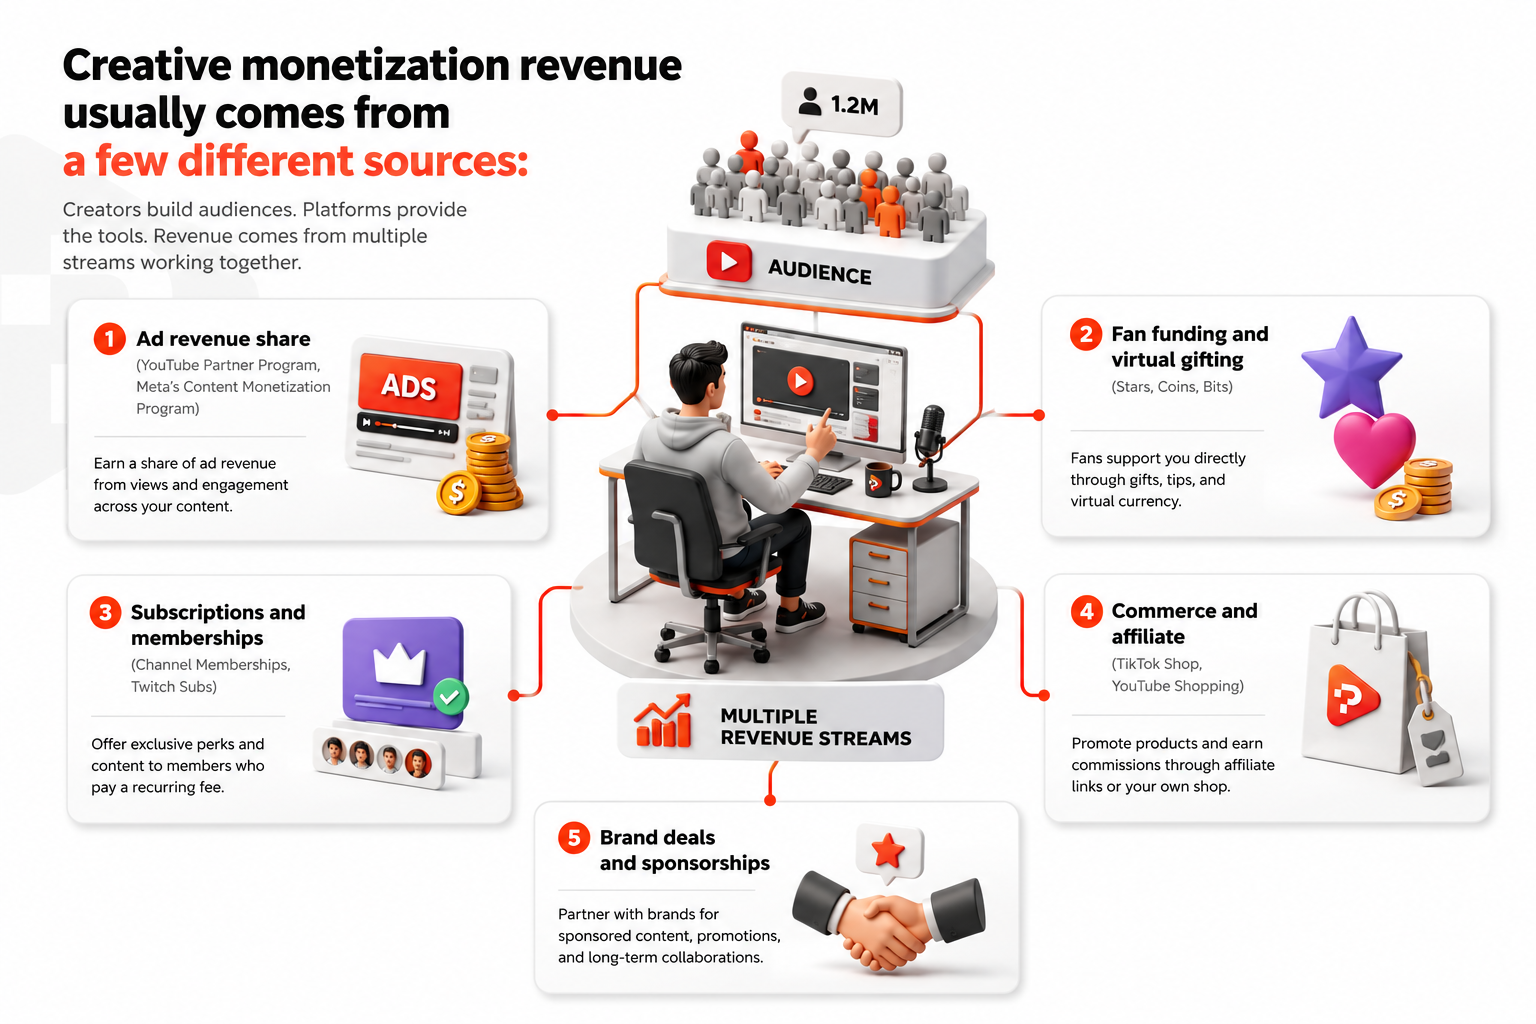
It's a real, fast-growing line that's still small relative to ads.
iOS vs. Android
For advertising, the store is close to irrelevant, since ad dollars never touch Apple or Google's billing systems at all. What decides ad revenue is DAU and engagement density, wherever that engagement happens to occur.
Store starts to matter only for the smaller, faster-growing creator layer. Gifts, coins, tips, and creator subscriptions are all billed as in-app purchases, which means both platforms take their standard commission regardless of OS. Build your growth model on the assumption that ad revenue is platform-agnostic, but bake in the 15-30% tax into the the creator-monetization layer from day one.
Operator tip
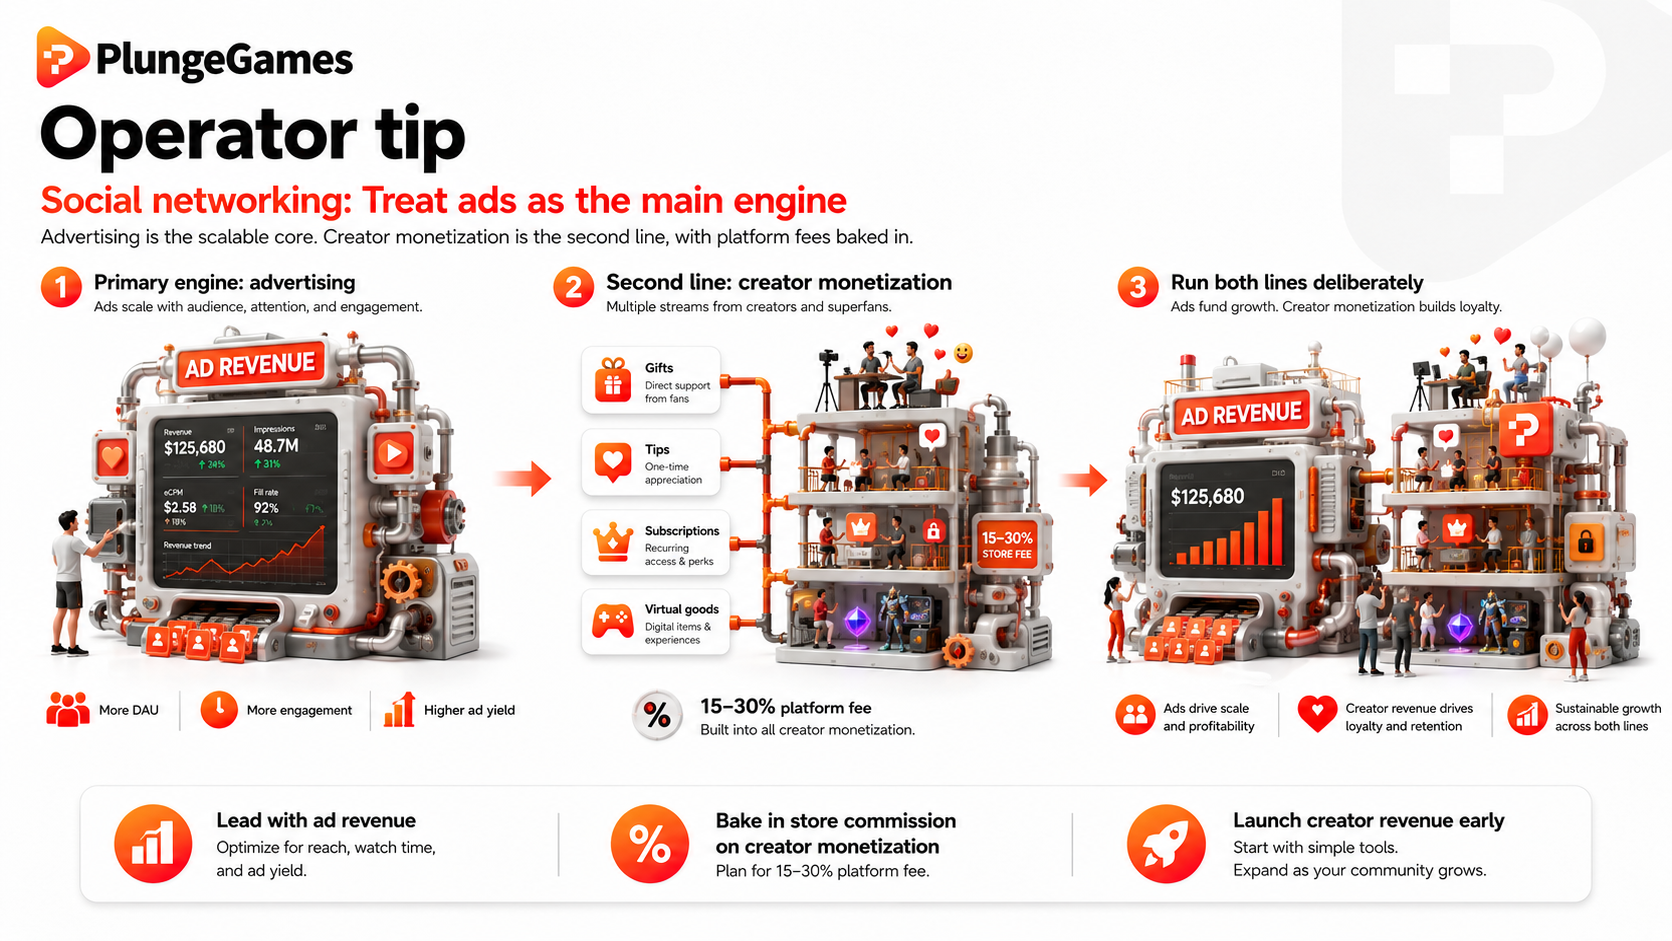
If you're building a social app, treat advertising as your primary, scalable revenue engine - it's what every major platform in this category runs on. And unlike creator monetization, it's never taxed by Apple or Google's commission.
Build creator monetization as a real second line, with the 15-30% platform commission baked in from the start for the store-billed types - gifting, tips, subscriptions - since that's a permanent cost your ad revenue never carries. And don't wait for a large user base to introduce it. YouTube's payout growth shows this scaling as a true separate line, not something that switches on automatically once ads are working.
7. Productivity: Offer freemium as the gateway to team pricing
Almost every productivity app approaches monetization the same way: a generous free tier that works well enough for one person to get hooked. But the individual user is never really the target. The business model depends on that person bringing the tool into a team, at which point pricing shifts entirely from free forever to a per-seat monthly charge that scales with headcount.
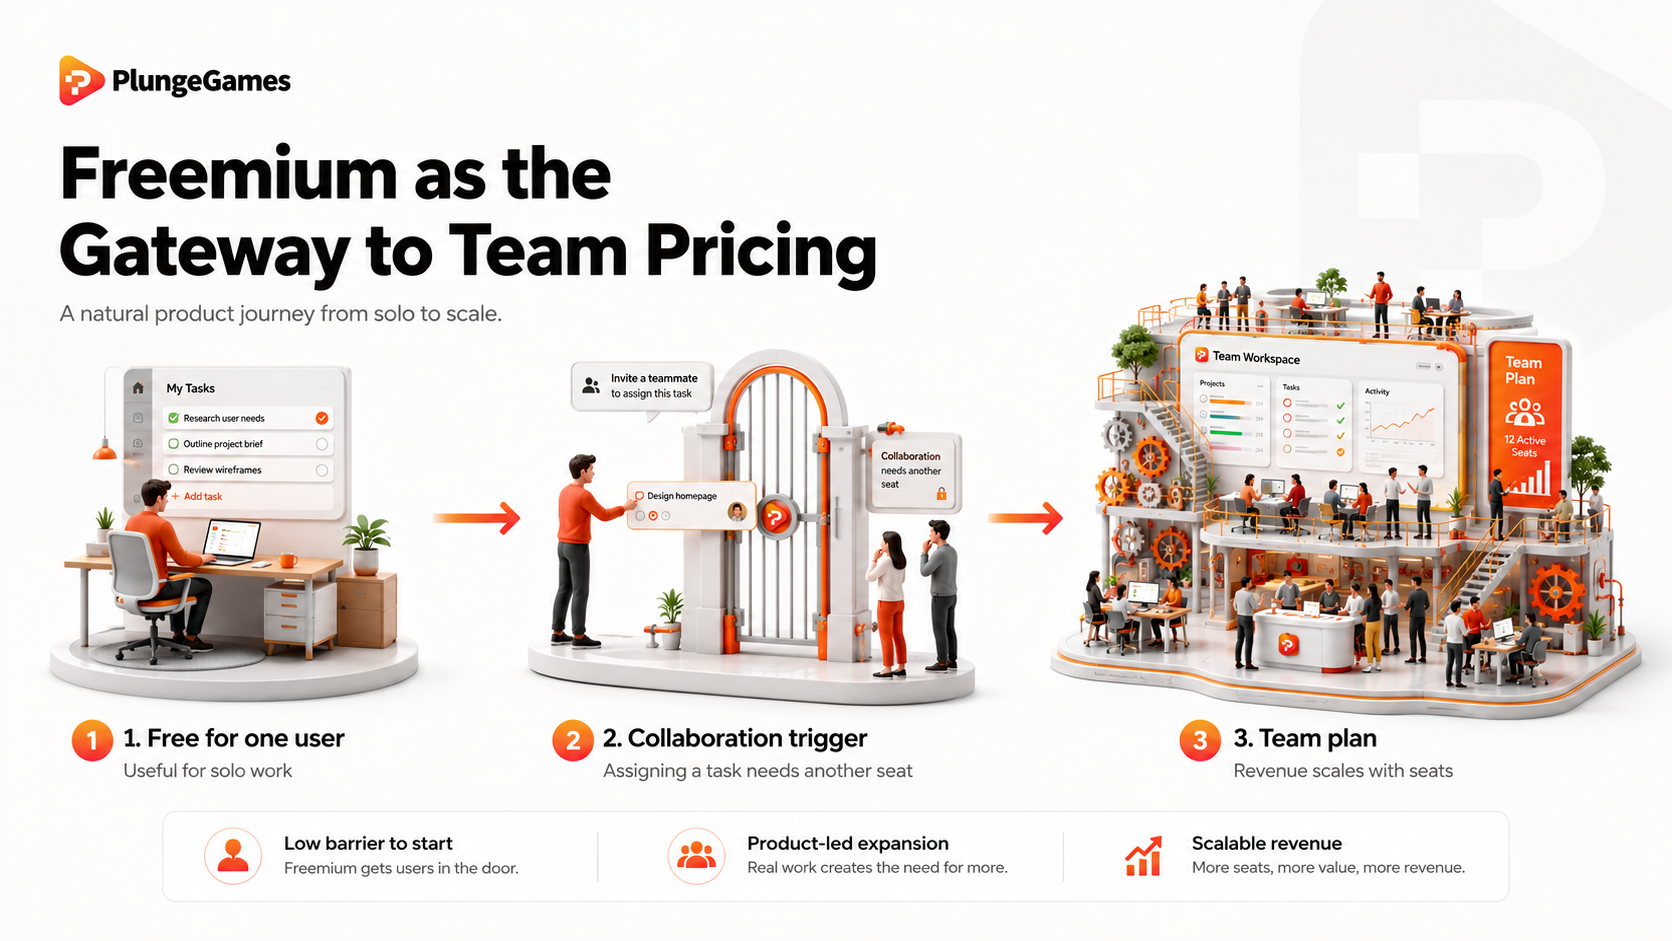
Productivity apps generated $32.5B in 2024, led by office suite apps at $19B, with AI apps contributing a smaller but fast-growing $4.5B. This revenue primarily comes from team plans. Take Asana, for example. Its "Core" customers (organizations spending $5,000 or more annually, effectively its team and enterprise tier) represented 72% of the company's full fiscal year 2025 revenue, despite being a small fraction of total signups.
Notion, still private, is estimated at roughly $600M in annual recurring revenue with over 100M total users. But only around 4M of these are paying users - a roughly 4% conversion rate typical of freemium PLG products, where the free tier's job isn't direct monetization. It's building the top of the funnel wide enough for the team-upsell math to work. Notion's own pricing structure makes the ceiling explicit too: free for individuals, then $10/seat and $20/seat once a team adopts it. Plus, the company moved its AI features out of a standalone add-on and into the $20/seat Business tier specifically to push upgrades from individual and small-team plans toward full team adoption.
iOS vs. Android
Store commission structure matters less here than in most other categories, because most productivity tools sell subscriptions through their own website rather than app store billing. They sidestep the store commission on both platforms.
Where OS does still show up is in the shape of the funnel: iOS converts subscriptions at a higher rate, while Android brings more install volume at lower conversion. That pattern makes the collaboration-trigger paywall - the moment a second person joins - worth testing at different points depending on platform. On Android, where conversion is lower, you may need a longer runway of value before the ask lands; on iOS, the trigger can likely fire sooner.
Operator tip
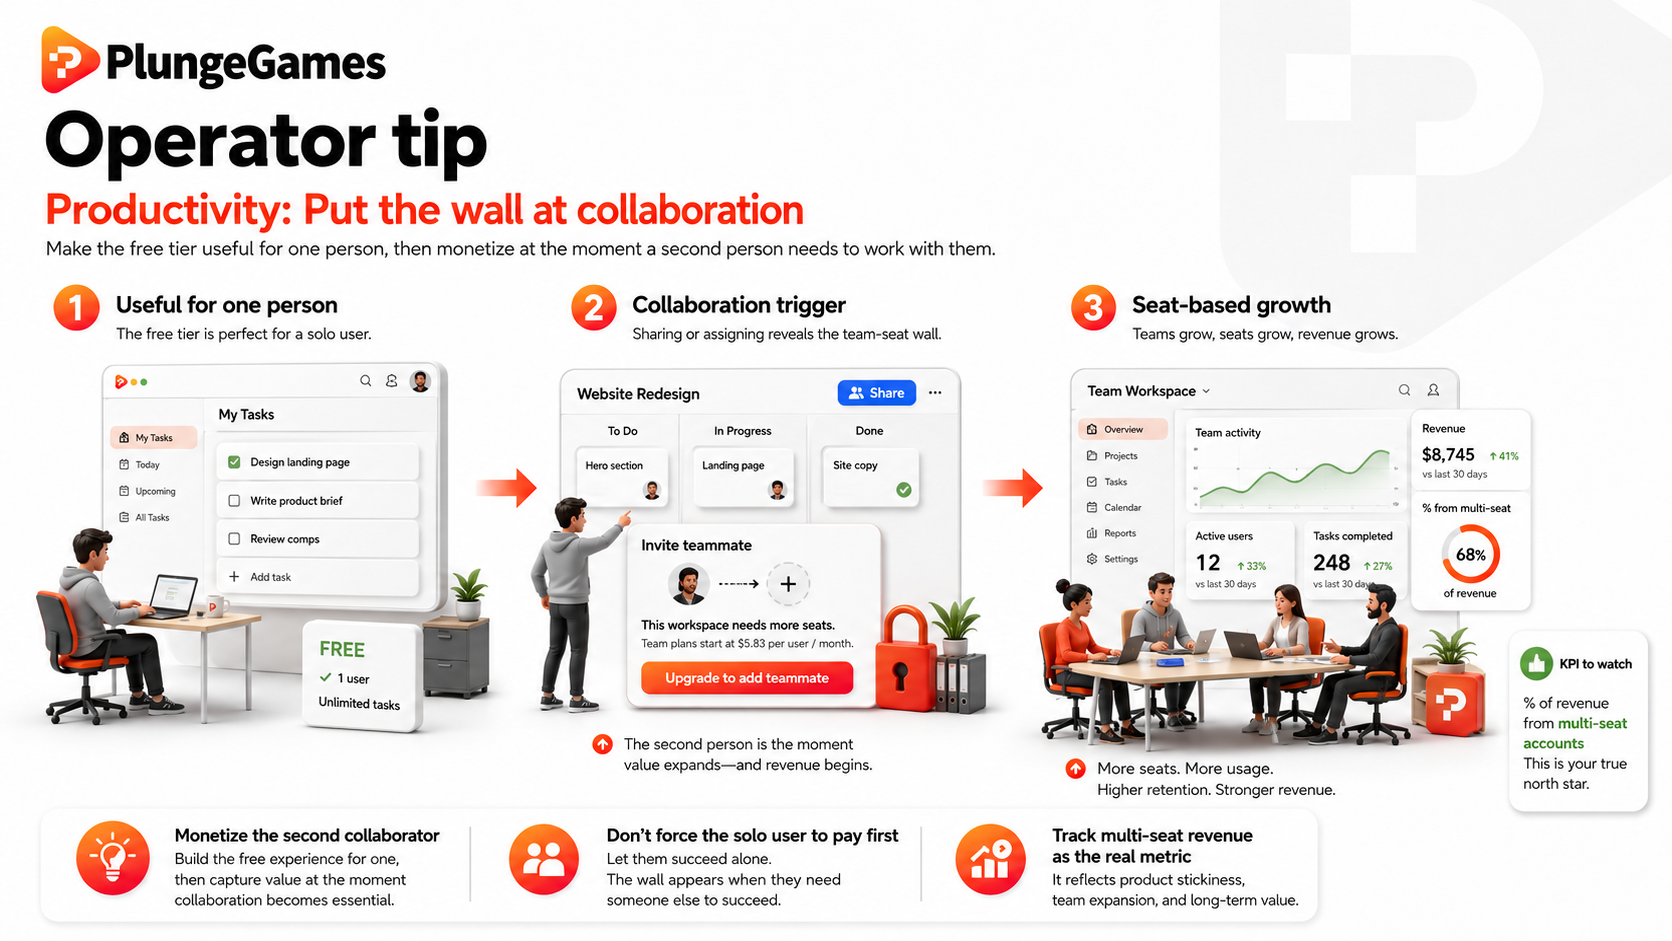
Design your free tier to be useful for a single person, but build the wall at exactly the point where a second person needs to collaborate, like sharing a board or assigning a task to someone else. That's the natural, non-pushy moment to introduce seat-based pricing. Don't try to monetize the individual user directly.
Track what percentage of revenue comes from multi-seat accounts specifically, the way Asana tracks its "Core" customer definition. And treat that number, rather than total signups, as your real growth metric.
Genre Fit Isn't a Constraint. It's the Shortcut.
Seven categories, seven dominant models. None of that is a coincidence, and none of it is optional - it's what the category rewards, and the store thread runs underneath all seven the same way: iOS and Android don't reward the same things, and the gap shows up differently every time, from a straight revenue split in Dating to structural irrelevance in Finance.
Studios that build with their category's model in mind ship faster and convert better. Studios that fight it spend six months A/B testing their way toward a paywall that was never going to work for what they built.
If you're not sure which model fits where you're building, or your conversion numbers don't match your category's benchmarks, talk to Plunge.